Prev Project
Next Project
Close Project
Case Study
Google Travel
Be the trusted place where travelers go for the most useful information to make fast, effortless decisions.
Brief
Since joining Google, I’ve had the privilege to build products in the service of hundreds of millions. Most notably, I led the unification of the Google Travel products under a single brand and navigation structure.
Challenge
This entailed inspiring and motivating a coalition of executive sponsors who were skeptical of a cohesive offering. I believe the lasting partnerships I formed and the credibility I gained were a function of diligence in my preparedness, on-the-fly adaptability, and the time I committed to over-communicate key toggle points in our strategy. To realize the new brand identity, we partnered with the external agency Wolf Ollins.
Impact
Google Travel products serve hundreds of millions of monthly active users. In 2019 I led product design to unite the disparate verticals (Trips, Flights, Hotels, etc) under a unified navigation and brand identity.
Difficulty
Before joining, uniting the Google Travel products had been a faltering project for over six years. I was able to inspire support, then work with stakeholders from across the verticals to realize and successfully launch.
Leadership
Organized and led a series of cross-functional meetings over the course of a year to arrive at a workable proposal, roadmap, and identity system resulting in buy-in at the director and VP level.
Brand buy-in
Achieving brand buy-in for a product at the scale of Google Travel required a combination of market research, external agency partnerships, and substantial internal awareness campaigns, such as 'Why Travel?'
Reflection
Adding a flagship identity to Google's brand portfolio requires equal parts metrics driven research and human-centered principles. If the brand doesn't resonate with people, it follows that metrics won't converge the way you'd like. Likewise, if you optimize the brand for a specific market, you could easily alienate others. To art direct Google Travel, I had to dig deep into my skillset. I created a data-viz encompassing all (thousands) Google's branded marks to distill common visual language principles. The analysis added a quantitative emphasis on the largely subjective visual design giving senior stakeholders a common language to offer feedback around. Landing this brand has been one of my favorite experience at Google since it brought together equal parts strategy and human-centered asthetics.
Project
People + AI Guidebook
The People + AI Guidebook was written to help user experience (UX) professionals and product managers follow a human-centered approach to AI.
Brief
While building products by day, I embarked on an ambitious grassroots journey by night. Together, a fellowship of five Googlers and I recognized a gap in the principles and processes by which AI-powered features were being conceived and developed. Over the course of a year, we synthesized data and insights from internal product teams, industry experts, and academic research. From our insights, we crafted the People + AI Guidebook, an open source resource advocating for a more human-centered approach to AI.
Challenge
Working on the People + AI Guidebook has been a life changing endeavor for me. Fiercely advocating for even stronger human sensibility and values within machine intelligence has stretched and deepened my own design philosophy. Working alongside passionate teammates filled me with bottomless energy and I loved the process of distilling opaque academic theory into concrete and actionable recommendations.
Learn more
Project
Relational Design
Examining the possibility of systems, lateral thinking, and the role of storytelling in futurecasting for assistive products and features.
Brief
Human-centered design shifted designers from a fascination with things to people and brought design thinking, empathy and humanity into the mainstream of product and program development after mass industrialization. With globalization, an unflinching focus on consumers, and the emergence of exponential technologies like AI making the world increasingly complex, has this conception of design centered on humans run its course?
Challenge
There's a growing mindset that centering on individual and consumerism in design has gone too far. How do we combat this, and what's next for design? This talk will dive into another idea, going back to the relational aesthetics movement and thinking deeply about group participation and the role of the user, and why it is essential with the growth of technologies.
Case Study
Museum
Accelerating neuroscience research and discovery by open sourcing a collaborative, online platform.
Brief
At SeungLab scientists study Connectomics, a specialty in the domain of Neuroscience which seeks to understand brain structure and function by constructing comprehensive maps of the connections between neurons. Traditionally, Connectomics is a tedious and time consuming process performed by manually tracing through a volume of micrographs like a 3D coloring book. To glean meaningful information from biological neural networks, many thousands of neurons must be reconstructed. Researchers at SeungLab specialize in volumetric neuron reconstruction and employ sophisticated Machine Learning + Computer Vision techniques in collaboration with expert tracers to rapidly accelerate this process.
Challenge
To catalogue the complexity of the human brain, researchers at Seunglab are working towards an automated pipeline for gathering and processing experimental data. However, neuroscience has a data problem and Seunglab is no exception. Researchers have an excess of data and a lack of investigative power. The scale of today’s scientific challenges demand cross–disciplinary collaboration. Collaboration presents an opportunity for teams to leverage each others specialties to move faster and tackle larger and more important problems. Collaboration necessitates sharing of knowledge, time, ideas, skills, and increasingly data. How can researchers at Seunglab benefit from collaboration?
Design Process
D5
Deliverable
00/06
Key Features
Open Source
Neuroscience
Free to Use
Responsive
Web Application
Interactive Graphs
Figure Generator
Persistant URLs (permalinks)
Solution
Collaboration
We partnered with Seunglab to design, develop, and deploy a responsive, open source, web application targeted towards neuroscientists with the goal of assisting researchers in the classification of new neuron typologies.
Iterative Development
Using Google’s Material Design library as basis for interaction patterns, we rapidly deployed a beta version and began extensive prototyping while seeking usability feedback from a host of researchers and designers. We continued prototyping for two months–refining touch points, tweaking the usability and functionality of charts, improving mesh loading performance, and adding features like auto-complete search to name a few.
Looking Forward
After the push to production, we handed off our design + development guidelines to the team at Seunglab where researchers continue to grow the platform with feedback from the scientific community.
The Museum provides scientists access to thousands of neuron reconstructions. When viewed individually each cell is rendered in white to shift focus towards the unique formal characteristics.
Explore Live
Design Process
D5
Discover
01/06
The Discover phase aims to know your client, their brand and their customers while gaining a full understanding of the project. This is essential to allow the design team to understand the task, develop a feel for the client’s business or interest, become familiar with the user and empathize with the brand.
Sebastian Seung (pictured above) is a leader in the new field of connectomics, currently the hottest space in neuroscience, which studies, in once-impossible detail, the wiring of the brain.
Hello, Seunglab
At Seunglab scientists study Connectomics, a specialty in the domain of Neuroscience which seeks to understand brain structure and function by constructing comprehensive maps of the connections between neurons.
Traditional Connectomics
Traditionally, Connectomics is a tedious and time consuming process performed by manually tracing through a volume of micrographs like a 3D coloring book.
Scaling Up
To glean meaningful information from biological neural networks, many thousands of neurons must be reconstructed.
Volumetric Reconstruction + ML
Researchers at SeungLab specialize in volumetric neuron reconstruction and employ sophisticated Machine Learning + Computer Vision techniques in collaboration with expert tracers to rapidly accelerate this process.
Connectomics
The production and study of connectomes, may range in scale from a detailed map of the full set of neurons and synapses within part or all of the nervous system of an organism to a macro scale description of the functional and structural connectivity.

C. Elegans
So far, C. elegans is the only organism that boasts a complete connectome. Researchers are also working on connectomes for the fruit fly nervous system and the mouse brain.
Market Research
Given the academic nature of the Museum, we viewed Market Reaserch as an oppertunity to learn from peer successes and failures—essentially compile a list of best practices for engaging with data and the scientific community at large.
Projects generally include a wealth of data along with supporting methods, empiracle results, and sometimes publications.
Most data + figures support permalink option for robust citations.
Good tools for filtering and exploring the data.
Projects may include SDK + API packages for building custom applications from data.
Do's
Information design could benifit from a designers touch. Complex jargon can inhibit glanceability for all but seasoned experts.
Repository generally not responsive, useful only on desktop.
Information architecture mostly flat, could benifit from chunking, progressive disclosure. Lack of onboarding.
Navigation often ambiguous at best.
Dont's
User Stories
Before comensing with design and development, we conducted interviews, site visits, and other forms of ethnographic research to gain insight into the lives of our potential users.
Stakeholders
SeungLab
Researchers at SeungLab are highly skilled at gathering, managing data and thus have an excess of it but a lack of investigative power.
Individuals
Neuroscientist
Has hypotheses that may require additional data for substantiation. Needs general information about cell typologies.
Neuroanatomist
Has hypotheses that may require additional data for substantiation. Needs specific information about cell morphology and physiology.
Student: Undergrad
The brain is the most complex system in the known universe, learning by interacting with real cells + data leads to deeper processing and increased retention.
Student: Graduate
Graduate students in search of a first publication can explore the museum in search of supporting evidence.
Gamer: Eyewire
The museum functions as a repository of all the cells mapped by gamers on Eyewire. Here, players can come explore their work and marvel at the complex beauty of the cells.
Curious Surfer
Neuroscience and the brain are at once beautiful and mysterious. Why not spend a few hours browsing through the basis of thought?
Organization
Lab
Research labs all have unique specializations. The museum may be contain just the data necessary for their next paper.
University
Professors often balance an active research practice alongside their teaching careers. The museum offers another aid for explaining the brain at the cellular level.
Eyewire
As a leading citizen science project, Eyewire is tasked with sharing the beauty and complexity of the brain with non-experts.
Observations
We conclude the Discover stage by focusing the values, needs, and challenges of our subjects.
Publish or Perish
Researchers have an excess of data and a lack of investigative power.
Scale = Collaboration
The scale of todays scientific challenges demand cross–disciplinary collaboration.
Go Big or Go Home
Collaboration presents the opportunity for teams to leverage each others specialties to move faster and tackle larger and more important problems.
Sharing = Caring
Collaboration necessitates sharing, of knowledge, time, ideas, skills, and increasingly data.
Design Process
D5
Define
02/06
The strategic decisions make in the Define phase will determine the success or failure of the project. Based on the business goals, a communication strategy for the chosen digital touch points must now be developed. Based on the brand goals, we will create the design principles. With the help of user insights, we will develop guidelines for the user experience. Based on all the goals and requirements, we will define metrics for measuring success.
Framing our Challenge
During the Discover phase we go super wide to understand the problem space and gain perspective from the point of view of our users. The Define phase presents an oppertunity to focus our research and frame our challenge through a series of simple internal questions.
What is the problem you're trying to solve?
Researchers have an excess of data and a lack of investigative power.
What is the ultimate impact that you're trying to have?
Enable more people, both expert and non-experts, to engage with neuroscience.
What are some possible solutions to your problem?
Given the ease of scalability and potential for rapid development, creating a web-based application seems to be the most feasible option.
What are some of the constraints + context?
We have a small team for both design, research, and development, and shorter than expected schedule for launching a usable product.
Hello, User
Our research concluded that we should focus our efforts on designing a product for neuroscientists, as they are the demographic that aligns most closely with our available data and (after students) the most numerable.
Project Requirements
The Museum will function as an open repository for connectomic neuron reconstructions of neruons from Seung Lab. Below is an overview of the design and development considerations.
Context
Application
Create a responsive web application for visualizing and exploring connectomic data powered by a leading framework.
Data Access
Mesh Delivery
An efficient pipeline for delivering and displaying 3D neuron meshes.
Data Delivery
A system for delivering supplementary connectomic data for neuron meshes.
Citation
A system for generating semantic and persistant publication–quality citations.
Visualization
Onboarding Diagrams
Create an introudction to the project, data and Museum interation model.
3D Viewer
A 3D environment capable of accurately displaying neuron meshes and supporting annotations.
Skeleton Density
An interactive graph displaying stratification density information for neuron meshes.
Directional Response
An interactive graph displaying directional response information for neuron meshes.
Temporal Response
An interactive graph displaying temporal density information for neuron meshes.
Supporting Meta–Data
Context relavant information supporting both 2D and 3D visuals.
Interaction
Browse Data
Progressively disclose infomration for users engagement.
Filter Data
Dynamically filter through connectomic dataset with respect to classification system.
Search Data
Auto-complete search throught connectomic data—by same categories available in filter.
Compare Data
Overlay connectomic information to see trends in both 2D and 3D contexts
Explore Data
Freely engage with connectomic data in both 2D and 3D contexts.
Manipulate Data
Quickly toggle, overlay, browse, filter, and search through connectomic information.
3D Navigation
Freely manipulate neuron meshes in 3D context using familiar interaction models.
Learn More (Context)
Where possible, provide additional context through user interaction or external links.
Share Views
Figure generator for quickly sharing publication–quality scientific figures.
Application Overview
Perhaps these stories could be prefaced by a quick paragraph stating the importance of User Stories and their particular relevance to this project. Following could be a figure to summarize the relative knowledge + complexity of user needs / features most likely to engage with.
Design Process
D5
Design
03/06
Styleguide
To ensure consistency across application elements and devices we created a set of standards ranging from idenity to typography, to color and interation models. We organized our styleguide into 6 progressive sections: Identity, Elements, Components, Compositions, Layout, and Views.
An excerpt from the Identity section of the styleguide. We formatted each section to be modular to enable rapid iteration cycles between design and development. Below, the Color section utilizes a decidedly conflicting pallet to promote uniqueness across many data streams.
User Journey
We focused our user journey map on the experience of a first time neuroscientist user. While extensive, the map is not meant to include all possible touch points of the Museum, rather it serves to detail the flow of a single user from their perspective.
Grid System
By this point in the process we had established Angular as our a front-end framework. This motivated an increasingly modular design language of nested + encapsualted components. Written content on the Museum consists of mostly static descriptions and labels. Without having to account for dynamically generated CMS content, the grid was able to remain in a relatively simple 8pt x 4pt system.
3D Controls
3D navigation is complex. Our research revealed that most scientists are interested in viewing the neurons from just two specific orientations: top and side. The accuracy of these views is dramatically improved by implementing virtual cameras with othographic projection as an alternative to standard perpsective projection. To facilitate swift comparisions we created a set of 3D control buttons for quick snapping between views and projections.
Design Process
D5
Deploy
04/06
Real Data
Having a solid understanding of content is critical when designing with technical materials. It turns out the end goal isn't to reduce the amount of complexity but rather to manage the level of it in a given view or interaction.
Data Driven Design
In the context of the Museum, data driven design means approaching the design of graphs and resulting information architecture through the lens of a scientist. We asked what data are most important and what is the best format for communication Our iteration process moved from digesting raw data to a cycle of sketching, implementing, user testing and refining through interative prototypes.
Closure Cards
Elements that are close together are perceived to be more related than elements that are farther apart. We used the pricnple of proximity to design a card system to encapsulate information and interative elements within relavant components.
Auto Complete
The problem of search in the Museum is knotty. Most classification categories are barely human-readible and cell names are stored as five or six digit strings. Searching can start from a place of uncertainty. A simple implementation of auto–complete text entry offers attractive advantages in both speed and usability.
Design Process
D5
Discussion
05/06
Reflection
The Museum was a perfect storm of a project. Extensive ethnographic research paved the way for a truly human-centered design process. Our team was able to match user needs with stakeholder expectations and deliver a fully functional product ahead of schedule. We tackled a complex problem with an iterative development cycle. Not every proposed feature made it to the current release but an extensive styleguide and robust development framework allow for extendability by a skeleton team of ressearchers at SeungLab.
Front-end frameworks are powerful ways to think about both the development and design cycles for web applications
Sharing design prototypes early on with both stakeholders and users helps to keep the project grounded.
Leveraging existing design systems like Google's Material Design Lite accelerate both design and development.
Thinking small to go big helped to keep feature creep to a minimum.
Do's
You are not your user. Don't make the mistake of thinking you (as a designer) know best when it comes to prioritizing features.
You don't have to go it alone. Don't be afraid to ask for input from team members when diving in to the dev space, making a relable and readible code is what counts.
Dont's
Collaboration
We partnered with Seunglab to design, develop, and deploy a responsive, open source, web application targeted towards neuroscientists with the goal of assisting researchers in the classification of new neuron typologies.
Iterative Development
Using Google’s Material Design library as basis for interaction patterns, we rapidly deployed a beta version and began extensive prototyping while seeking usability feedback from a host of researchers and designers. We continued prototyping for two months–refining touch points, tweaking the usability and functionality of charts, improving mesh loading performance, and adding features like auto-complete search to name a few.
Looking Forward
After the push to production, we handed off our design + development guidelines to the team at Seunglab where researchers continue to grow the platform with feedback from the scientific community.
Explore Live
Project
TEDxBeaconStreet
Volunteering as design director to create a distinct and memorable brand for a Boston TEDx chapter.
Brief
Growing up, TED talks were an indispensable source of inspiration for me. Through TED talks I was afforded access to a world full of ideas and possibility. One talk in particular by Kevin Slavin titled “How algorithms shape our world” had a profound impact in shaping my own world. To this day I am in awe of his delivery, pacing, and the way he weaved together just the right metaphors to convey his message in a memorable way. I never could have imagined that years later, I’d be collaborating with him directly, at MIT Media Lab.
Challenge
Volunteering to be the design director for TEDxBeaconStreet was the first time I was able to use my professional skills to give back to a community that profoundly shaped me. TEDxBeaconStreet is funded by a non-profit organization. So I deployed my background in computational design to develop data-driven branding techniques, and multimedia installations at a fraction of the cost.
Project
BrainVR
How does a brain make a mind? Experience the wonder in virtual reality at Tribeca Film Festival.
Brief
Thanks to cutting edge artificial intelligence, nanoscale resolution imaging, seriously powerful computers, high resolution portable displays and unprecedented international collaboration, Eyewire and the Fluid Interfaces Group at MIT Media Lab brought a never-before-seen interactive immersive neuroscience visualization to Tribeca Film Festival on April 18, 2016. In Virtual Reality, visitors were able to teleport into a foreign yet familiar world to explore a new pathway of narrative - the electrophysical connections among neurons. They ventured into a freshly discovered circuit of cells responsible in part for the brain’s ability to perceive motion - the very ebb and flow of story itself.
Challenge
Conceptualizing the BrainVR experience was a collaborative process among neuroscientists, HCI researchers, and exhibition organizers. Further, we were experimenting with emerging positional tracking for immersive VR experiences which introduced new dimensions to the project. The biggest challenge of all was communicating a complex scientific discovery in a fun and familiar way that our audience would immediately grasp. To this end, we created a telepresence in the form of a friendly robot to help walk participants through the virtual space.
Project
Synapse
Prototyping a possible future for the worlds smartest citizen science project.
Brief
Eyewire is a game to map the brain in collaboration with the Seung Lab at Princeton. Anyone can play and you need no scientific background—over 200,000 people from 145 countries already do. Together they are mapping the 3D structure of neurons; advancing the quest to understand ourselves. To achieve viral and sustained growth, Eyewire will need to invest in improved user experience design. UX design is the process of enhancing user satisfaction and loyalty by improving the usability, ease of use, and pleasure provided in the interaction between the user and the product.
Challenge
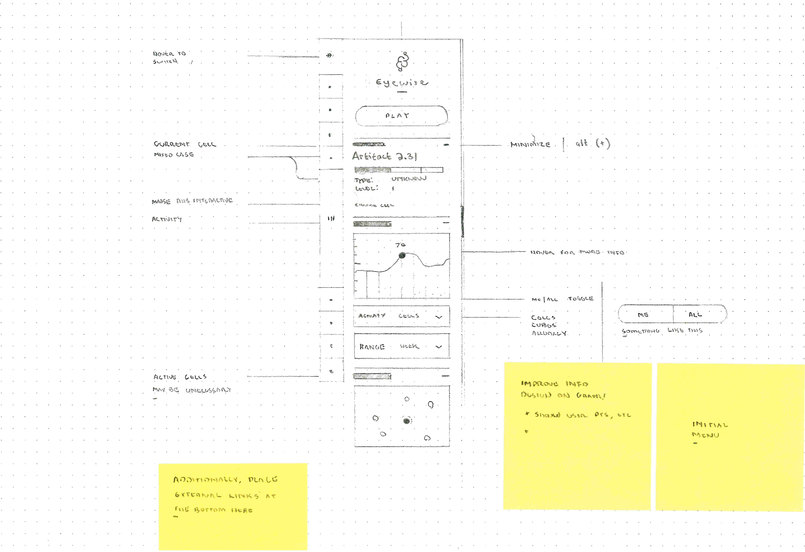
What would the future of Eyewire look like? How would it behave? Shrugging aside current browser limitations, I set to work designing and prototyping my vision for the future of Eyewire. This prototype uses elements from a new design language I've been developing, it's built using a combination of Sketch, FramerJs and threejs.
Key Features
Atomic Design System
Framer Prototype
Notification System
8pt Grid System
Blur–Behind Style
Iterative Design Cycle
(Above) Synapse was designed as a vision. Free of cross-browser limitations, I explored formal and stylistic possibilities usually reserved for native applications. I found that the blur–behind effect (currently only available in Webkit–based browsers) was quite useful in preserving 3D content, while providing a futuristic aesthetic. It also complimented the dark-UI, shifting the users focus to the 3D neuron.
Try it Live
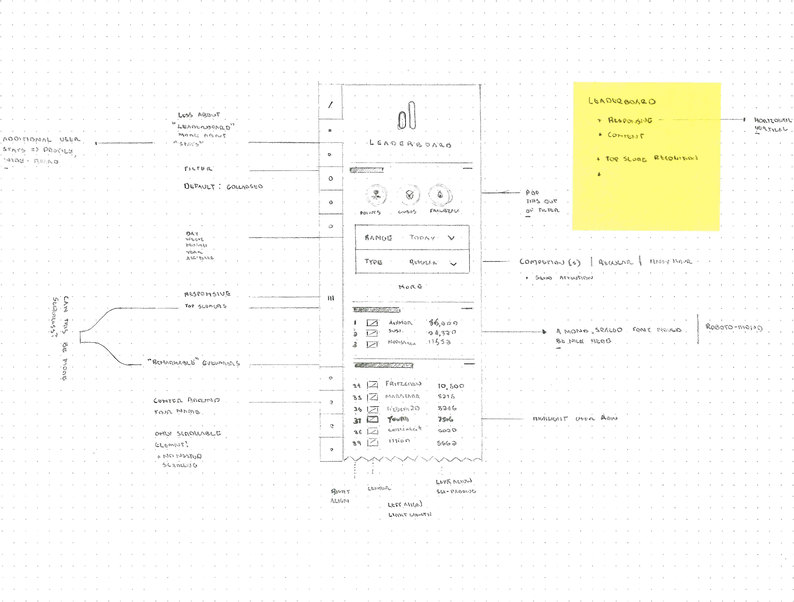
Notification System
The primary motivation for this project was to prototype a new in-game notification system. We began this process with a series of brainstorming sessions where we listed and categorized all the possible game states in Eyewire. From there we chose to pursue announcement notifications for our initial MVP. Announcement notifications are notifications that appear when a new game state has been reached. They come in three flavors: Individual, Targeted, and Global.
Individual Examples (Personalized messages to individual players)
Success
You completed 10x growth with project Neo!
Top Player of Day
You were yesterday’s top player of the day with xxxxx points!
Top Ten Monthly
You were in the top 10 players for this month at #7!
Promotion
You were promoted to the role of Scout.
Targeted Examples (Personalized messages to targeted player groups)
Competition
The competition ends in 30 mins! Time to make your move.
Competition
The competition has ended. Check the leaderboard for final scores.
Competition (Candy World)
On 12/17 get catapulted into a tooth-achingly sweet world(link to blog).
Challenge (Mergamatic)
Find a merger in the current overview cell.
Global Examples (General messages intended for the entire player base)
Big News
Eyewire just published a paper on xyz (link).
Big News
We just completed sector 5 in The Dig (link).
Telegram
We need some players to help us finish cell xxxxxxx.
Tech Fail
Grim’s stuck in the servers again! Try panda cam while you wait (link).
Atomic Design
Iterative design + development strategy demands the systematic organization of project assets. I have found the principles of Atomic Design conducive to this process. Inspired by physics of the natural world and possibly the divide and conquer algorithms of computer science space, Atomic Design reduces project asset clutter into six unique types: Identity, Elements, Components, Compositions, Layout, and Views.
Identity
Styles: Typefaces, Typography, Color, Brand Assets
Elements
The simplest reusable items: Buttons, Drop–Downs, Nav–Bars, Footers, Switches, Toggles, etc
Components
Reusable combinations of elements: Cards, Dialogs, Forms, Prompts, etc
Compositions
Reusable collections of Components: Sidebars, Pop-Ups, etc
Layout
Grid System: I make use of two grids, one for local layout (8pt x 4pt) and another for global organization (8-12 responsive columns).
Views
Collections of Compositions, Components, and Elements: Overview, In-Cube, Scouts' Log, etc

Reflection
I started this project by interviewing Eyewire players and stakeholders. I then quickly worked alongside game admins and our game dev team to generate rough specifications for an MVP notification system. After a lot of initial sketching I moved to building out a solid file structure in preparation for an iterative design cycle between static assets in Sketch and the dynamic world of Framer. The Synapse prototype has been my first experience heavily integrating Framer into my design process. Though Framer has a significantly higher learning curve than something like Invision or Flinto, the potential is incredible. Having a strong foundation in programing, I find that Framer simplifies the development cycle for a number of common interaction design challenges like tuning microinteractions, designing with real data, and testing application behavior + feedback loops. Framer integrates super well with Sketch symbols speeding the refinement process for design language towards a sort of parametric system like many CAD software packages (Solid Works, 3ds Max, etc). I'm looking forward to working more with Framer.
Project
MSTY VR
Bringing the future of neuroscience exploration and education to virtual realms using the Oculus Rift.
Brief
In October of 2016, president Barrack Obama called upon a coalition of pioneering researchers, designers, technologists, and diplomats to gather at Carnegie Mellon University to demonstrate the very leading frontiers of technology. We were invited to this White House Frontiers conference to present our latest virtual reality experience: MSTY. The three pound organ sitting behind y our eyes is nothing short of extraordinary. Symphonic activity among billions of neurons gives rise to thoughts, feelings, and ultimately, the perspective and personality that turn a brain into a mind. Thanks to cutting edge AI, nanoscale resolution imaging, and the help of a quarter million gamers from around the world, crowdsources neuroscience sets the pace for a new wave of discovery. The creators of Eyewire reveal the first glimpse of Neo a cortical game coming 2017 that will invite gamers to solve the puzzles of perception.
Challenge
MSTY VR is our most recent virtual reality experience. It features a knotty entanglement of neuron reconstructions from cortex—the outer most layer of brain tissue responsible for perception. MSTY, so named for the particular flavor of AI involved in the reconstruction process, was intended to be a mostly passive safari-type experience. The user would be accompanied by a friendly, derpy, but exceedingly capable AI companion—MSTY. Inspired by Google's early ImageNet dataset and success in training neural networks to recognize cats in Youtube videos, we conceived MSTY as a hovering cat–like robot with paw–like arms. The experience lasted approximately 5 minutes, during which MSTY intelligently and naturally navigates toward areas of interest acting as a sort of subliminal tour guide.
(above) MSTY's brain, or a finite state machine created to naturally transition between all of MSTY's facial expressions and movement states. The particular state machine shown above included states for MSTY's location and interaction patterns.
Dynamic Depth of Field
Visualizing dynamic depth of field. A depth–mapped image where darker shades of gray represent sharper focus.
Project
Eyewire Explore
Refreshing Eyewire’s landing page with the addition of an interactive narrative-driven explore section.
Brief
Eyewire is a game to map the brain in collaboration with the Seung Lab at Princeton. Anyone can play and you need no scientific background—over 200,000 people from 145 countries already do. Together they are mapping the 3D structure of neurons; advancing the quest to understand ourselves. To achieve viral and sustained growth, Eyewire will need to invest in improved user experience design. UX design is the process of enhancing user satisfaction and loyalty by improving the usability, ease of use, and pleasure provided in the interaction between the user and the product.
Challenge
I challenged my team to design a mobile friendly solution for connecting prospective Eyewire players to the science and the story behind the citizen science project. Better UX through interative narrative will result in increased conversion and retension rates. I proposed a refresh to Eyewire’s current landing page and the addition of an explore section featuring complete support for mobile, tablet, and desktop devices. The increased context will allow prospective players to engage with Eyewire before entering the tutorial leading to substaintially increased conversion rates.
Design Process
D5
Deliverable
01/06
Key Features
Generative Design
Interactive Narrative
Responsive
Creative Code Prototyping
Custom Front-End Framework
Solution
Story–Telling
Eyewire is a citizen science project founded in Sebastian Seung's neuroscience lab at MIT. The project aims to gamify the process of assisting advanced machine learning algorithms in the reconstruction of 3D neurons from microscope images. This endeavor is unprecedented, even the elevator pitch for this game is a mouthful. Could we connect players more deeply to the science and vision of the lab with an interative experience?
Creative Coding
This project was my first attempt to align my passion for programming with my professional design practice. I worked primarily with Processing for prototyping and its Js cousin p5 for the final implementation. Early prototyping with Processing was swift and revealed lots of possible visual and behaviorial directions for the simulations. I learned a lot of hard lessons converting my native Processing code to work in the browser. Performance considerations across devices and inconsistencies across browswers lead to many hours of perfomance tuning and code reviews with our devlopers to help make the vision a reality.
Experiments
The explore page was sort of an experiment in browser-based narrative. We asked ourselves, what is the fastest, most lightweight way to deliver a message? In response, we explored a variety of story–telling techniques including generative design, infinite looping gifs and embeded video.
Responsive Design
Applying simple CSS transitions to responsive content can have delightful side effects like bringing heroes of neuroscience to life!
Design Process
D5
Narrative
02/06
Explore Story
Part I
Your brain makes you amazing / it allows you to learn intricate skills/ dream fantastic dreams / even laugh at goofy cat videos. But how?
Part II
This question has puzzled scientists for centuries. Your brain contains 80 billion neurons / connected through 100 milliion synapses. Working together, these cells make you, you. However, most of their circuits are still uncharted. When Galileo first peered through a telescope, it began a revolution in the way we see the world around us. Today, neuroscience is revolutionizing how we see the world within us. We're calling on gamers to help connect the dots by creating a visual 3D map of the brain.
Part III
We are wonderers.
Part IV
Eyewire is the first of its kind / its a 3D puzzle game / as you solve puzzles / you're mapping the brain.
Part V
Collaborate and compete for science!
(above) Storyboarding narrative content components and animation architecture.
Design Process
D5
Styles
03/06
Design Process
D5
Illustration
04/06
(above) I provided creative direction for an amazing illustrator + animator, Hyuna Choi. Together, we were able to create a cohesive color system and consistent visual style that captured the playful curiosity of the brand.
Design Process
D5
Generative
05/06
(above) One of the most common cell types found in Eyewire, the Starburst Amacrine Cell (SAC) is a retinal neuron that assists in motion detection. Its symetrical, circular branching pattern and flat profile make it a good candidate for 2D generative design.
(above) First eight iteration cycles of an experiment using l-systems to grow a SAC neuron. Initial results tended towards bushy trees.
Developmental System
My first strategy for growing life-like neurons was to use a developmental approach inspired by cellular division.
L-Systems
An L-system or Lindenmayer system is a parallel rewriting system and a type of formal grammar. An L-system consists of an alphabet of symbols that can be used to make strings, a collection of production rules that expand each symbol into some larger string of symbols, an initial axiom string from which to begin construction, and a mechanism for translating the generated strings into geometric structures (source Wikipedia).
(above) Inspired by techiniques in Daniel Shiffmans 'The Nature of Code,' the next Processing prototype used my own version of a traditional flocking algorithm.
Physical System
During development, neurons extend their branches by following chemical gradients through diverse tissues. I attempted to simulate this behavior with a swarm of autonomous agents governed by a physical system in Processing. This emergent behavior can be described by a surprisingly simple set of rules.
Cohesion
Steer towards average position of neighbors (long range attraction)
Separation
Avoid crowding neighbors (short range repulsion)
Alignment
Steer towards average heading of neighbors
Wander
Randomly change heading by a small amount each update step.
Poisson Disc Sampling
(Below) The human retina has a beautiful solution to sampling in its placement of photoreceptor cells. The cells cover the retina densely and evenly and yet the cells’ relative positions are irregular. This is called a Poisson-disc distribution because it maintains a minimum distance between cells, avoiding occlusion and thus wasted photoreceptors. (source: Mike Bostock, Visualizing Algorithms)
Signal Propogation
To facilitate neural transmission-like activity in the simulated neurons, I studied up on various graph traversal algorithms, Dijkstra, depth first search (DFS), and breadth first search (BFS). I settled on something in the realm of a BFS which is visualized below. Red dots are representative of signal transmission and green lines correspond to the current branch segment.
Animation Controller
Intergrating the neuron simulation with the rest of the explore page pushed my development skills to a new level. I learned new programing patterns and ways of thinking. The animation controller is composed of a series of small interconnected programs and supporting algorithms which coordinate the network of cells and mediate state with the rest of the experience.
Enivornment
Explore Page
We designed a custom front-end framework, duely named 'Synapse' which synchronizes the different animation modules using a global 'T' time.
Support Program
Neuron Coordinator
Neuron Coordinator is the main controller for the neural network. It synchronizes neuron-time with global 'T' time to ensure the experience stays in sync.
Neurostate
Each animation sequence within the neural network has a unique neuostate which governs the networks behavior with respect to 'T' time.
Neurotransmitter
Each Neurostate has an associated Neurotransmitter which monitors the networks state.
Neural Network
NNN
NNN, (short for Nortons Neural Network) is a super–class wich directly controls each of the neuron class objects.
Neuron
Neurons are controlled by the NNN class but exhibit control over both Node and Bouton classes.
Node
Nodes are controlled directly the Neuron class and operate as autonomous agents in the context of each Neuron.
Bouton
The Bouton class is controlled by the Neuron class and is responsible for two specific actions. First, Boutons are displayed at the tips of branches to mark the neuron growth process complete. Second, Boutons may move along the neuron branch to simulate signal propogation.
Utility Algorithms
Poisson-Disc
A sampling algorithm which nicely mirrors the spatial distribution of photoreceptors in our retinas. This algorithm is used to create the initial distribution of the neurons.
Kruskal-MST
A Javascript implementation of a classic minimum spanning tree (MST) algorithm used to pass signals around from neuron to neuron in the network.
Parse-SVG
A simple SVG parser to convert vector graphics into usable data format for animation in p5js.
Design Process
D5
Discussion
06/06
(above) Complete explore page experience, as viewed on desktop.
Reflection
This is usually the part of a project where I invite you two engage with the experience in real life—the explore page is a little different. Though the experience is fully functional, it was never pushed to production. Performance issues and inconsistencies plagued the neuron animation system. If I were to critic myself, I would admit that I bit off a whole lot more than I could handle. I designed + developed the Explore Page for close to six months but there is a point of diminishing returns where a design becomes more of a personal endeavor than one of service. I'm thankful for the many lessons learned, in the future I will seek to iteratively improve up on good design—rather than aim for a pillar of perfection.
Story–Telling
Eyewire is a citizen science project founded in Sebastian Sueng's neuroscience lab at MIT. The project aims to gamify the process of assisting advanced machine learning algorithms in the reconstruction of 3D neurons from microscope images. This endeavor is unprecedented, even the elevator pitch for this game is a mouthful. Could we connect players more deeply to the science and vision of the lab with an interative experience?
Creative Coding
This project was my first attempt to align my passion for programming with my professional design practice. I worked primarily with Processing for prototyping and its Js cousin p5 for the final implementation. Early prototyping with Processing was swift and revealed lots of possible visual and behaviorial directions for the simulations. I learned a lot of hard lessons converting my native Processing code to work in the browser. Performance considerations across devices and inconsistencies across browswers lead to many hours of perfomance tuning and code reviews with our devlopers to help make the vision a reality.
Experiments
The explore page was sort of an experiment in browser-based narrative. We asked ourselves, what is the fastest, most lightweight way to deliver a message? In response, we explored a variety of story–telling techniques including generative design, infinite looping gifs and embeded video.
Project
The DiG
Journey into the depths of the retina with the Dig, Eyewire's next big Adventure.
Brief
Eyewire is a game to map the brain that originated at Sebastian Seung's Lab at MIT. This citizen science human-based computation game challenges players to map 3D neurons in a retina. Eyewire was officially launched on December 10, 2012 and has since grown to over 200,000 players from 150 countries. Eyewire gameplay advances neuroscience by helping researchers discover how neurons connect to process visual information. Anyone, anywhere can help neuroscientists develop advanced artificial intelligence and computational technologies for mapping the connectome. In Eyewire, gamers solve 3D puzzles. As they solve the puzzles, they are actually reconstructing 3D models of neurons at nanoscale resolution from electron microscopy images. Eyewire requires no scientific background to play and works best on high speed internet.
Challenge
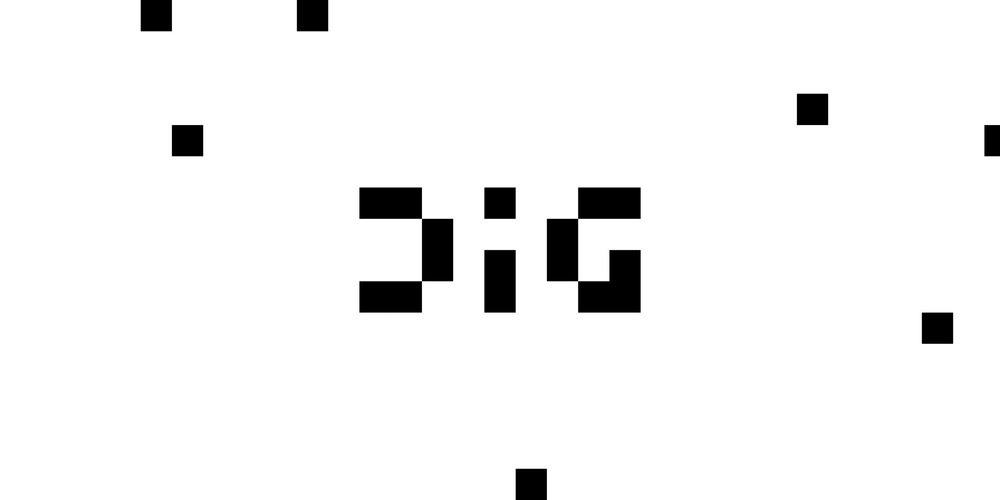
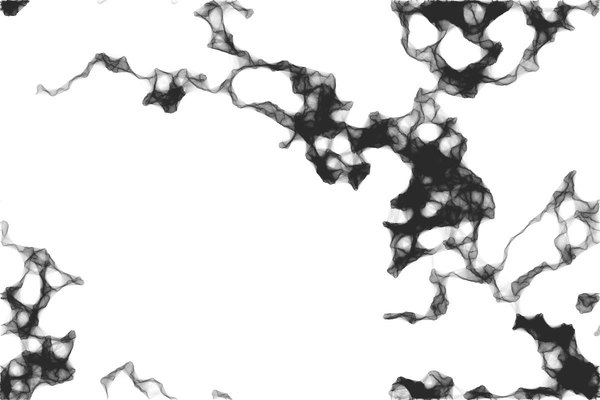
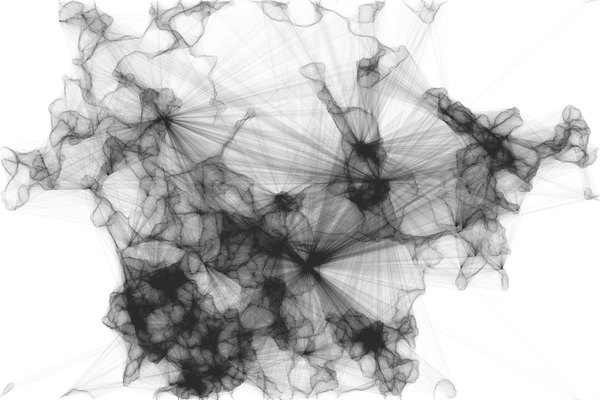
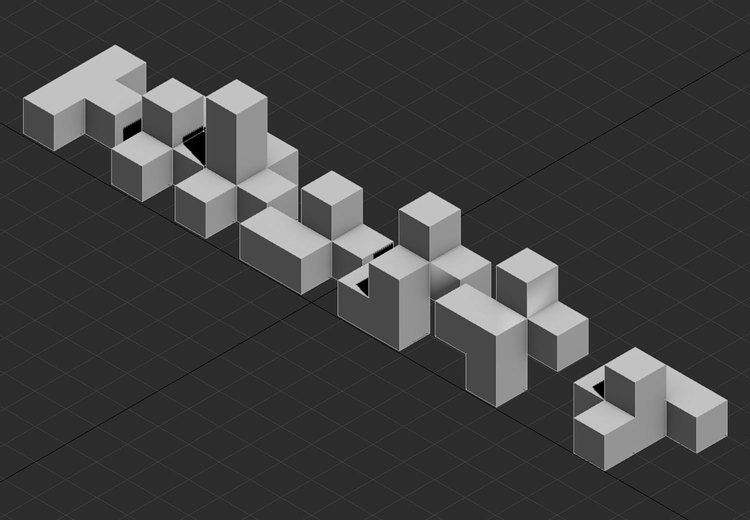
I was tasked with directing and developing the identity system, supporting brand materials, and promotional assets for 'The DiG', Eyewire's next big Adventure. Based on the nature of the game and a potential throwback to pychedelic rock anthem, we framed the challenge as a 'Journey into the depths of the retina'. The formal language was inspired by digital aspects of the neuron reconstruction, while the asset behavior was inspired by the computational processes of active neurons and cellular automata. The wordmark is composed of sixteen individual squares relating to the sixteen sectors of the scientific endeavor.


(above) Posters were printed and distributed across many Boston universities for a special local competition pitting students head-to-head for science! (below) The Dig consists of sixteen sectors, we created a count-up graphic to visualize player progress.
Algorithms + Process
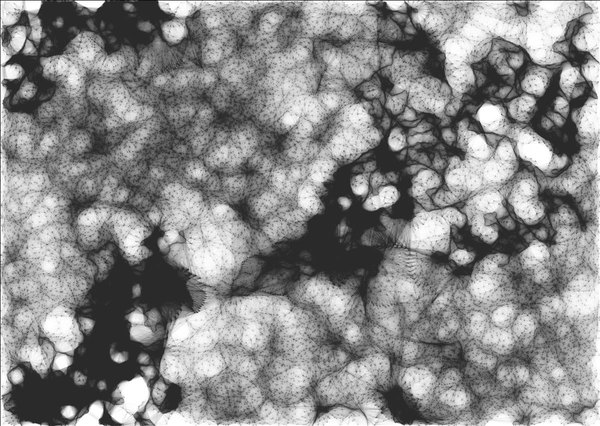
We developed a dynamic, generative, identity system with behavior inspired by the neuron reconstruction process and cellular automata. The algorithm afforded a nearly infinite range of original content for social media outlets. The denisity of black squares was designed to be related to the progress of the Dig.


Project
DAS
Design is not a discipline, but a way of looking at the world.
Brief
Real-world challenges require, perhaps more than ever, a deep, but interdisciplinary skill set combined with an ability to operate across multiple scales with creativity. Inspired by Neri Oxman's + Meejin Yoon's 'Design Across Scales' MIT Media Lab course, and naturally, Charles and Ray Eames’ canonical Powers of Ten, DAS explores the relationship between science and engineering through the lens of Design. It examines how transformations in science and technology have influenced design thinking, and vice versa. It explores interdisciplinary tools and methods to represent, model, design and fabricate objects, machines, and systems. DAS is organized by scale, topics ranging from the macro to micro are investigated across multiple problem contexts to demonstrate that design is not a discipline, but a way of looking at the world; one that promotes the synthesis of interdisciplinary knowledge across scales in order to create objects and systems for the greater good.
Challenge
Create a concept and deliverable for a minimalist quarterly publication operating at the intersection of design, technology, and people. Design the layout system, develop the brand and identity system, and assemble all of the content. And make it affordable—make it monochromatic. Can you design something people will actually want—imagine a journal for creative frontiers, a journal for the anti-discpliplinary, a journal for design across scales and problem contexts.
DAS Quarterly is organized both by content and by scale. This affords a new reading experience offering the reader another context to engage with the content. A system of minimalist icons were developed to accompany each major section.
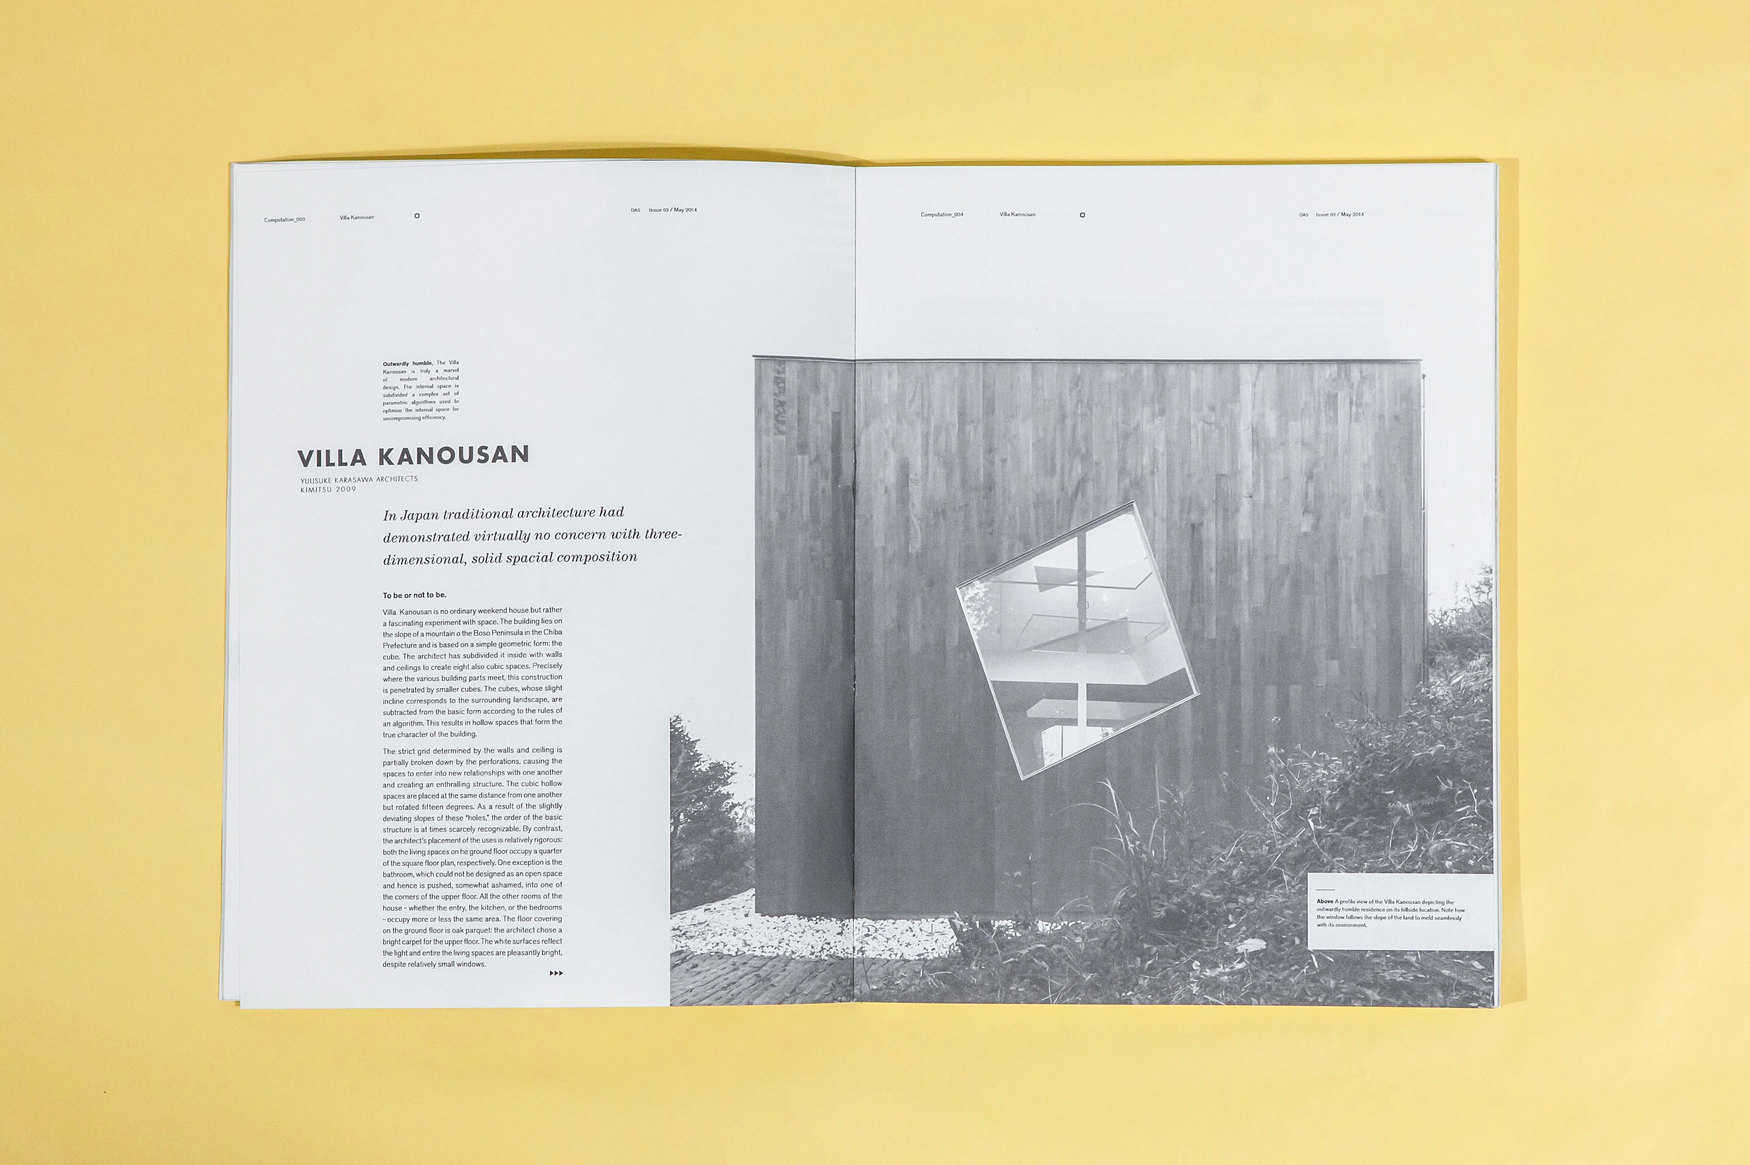
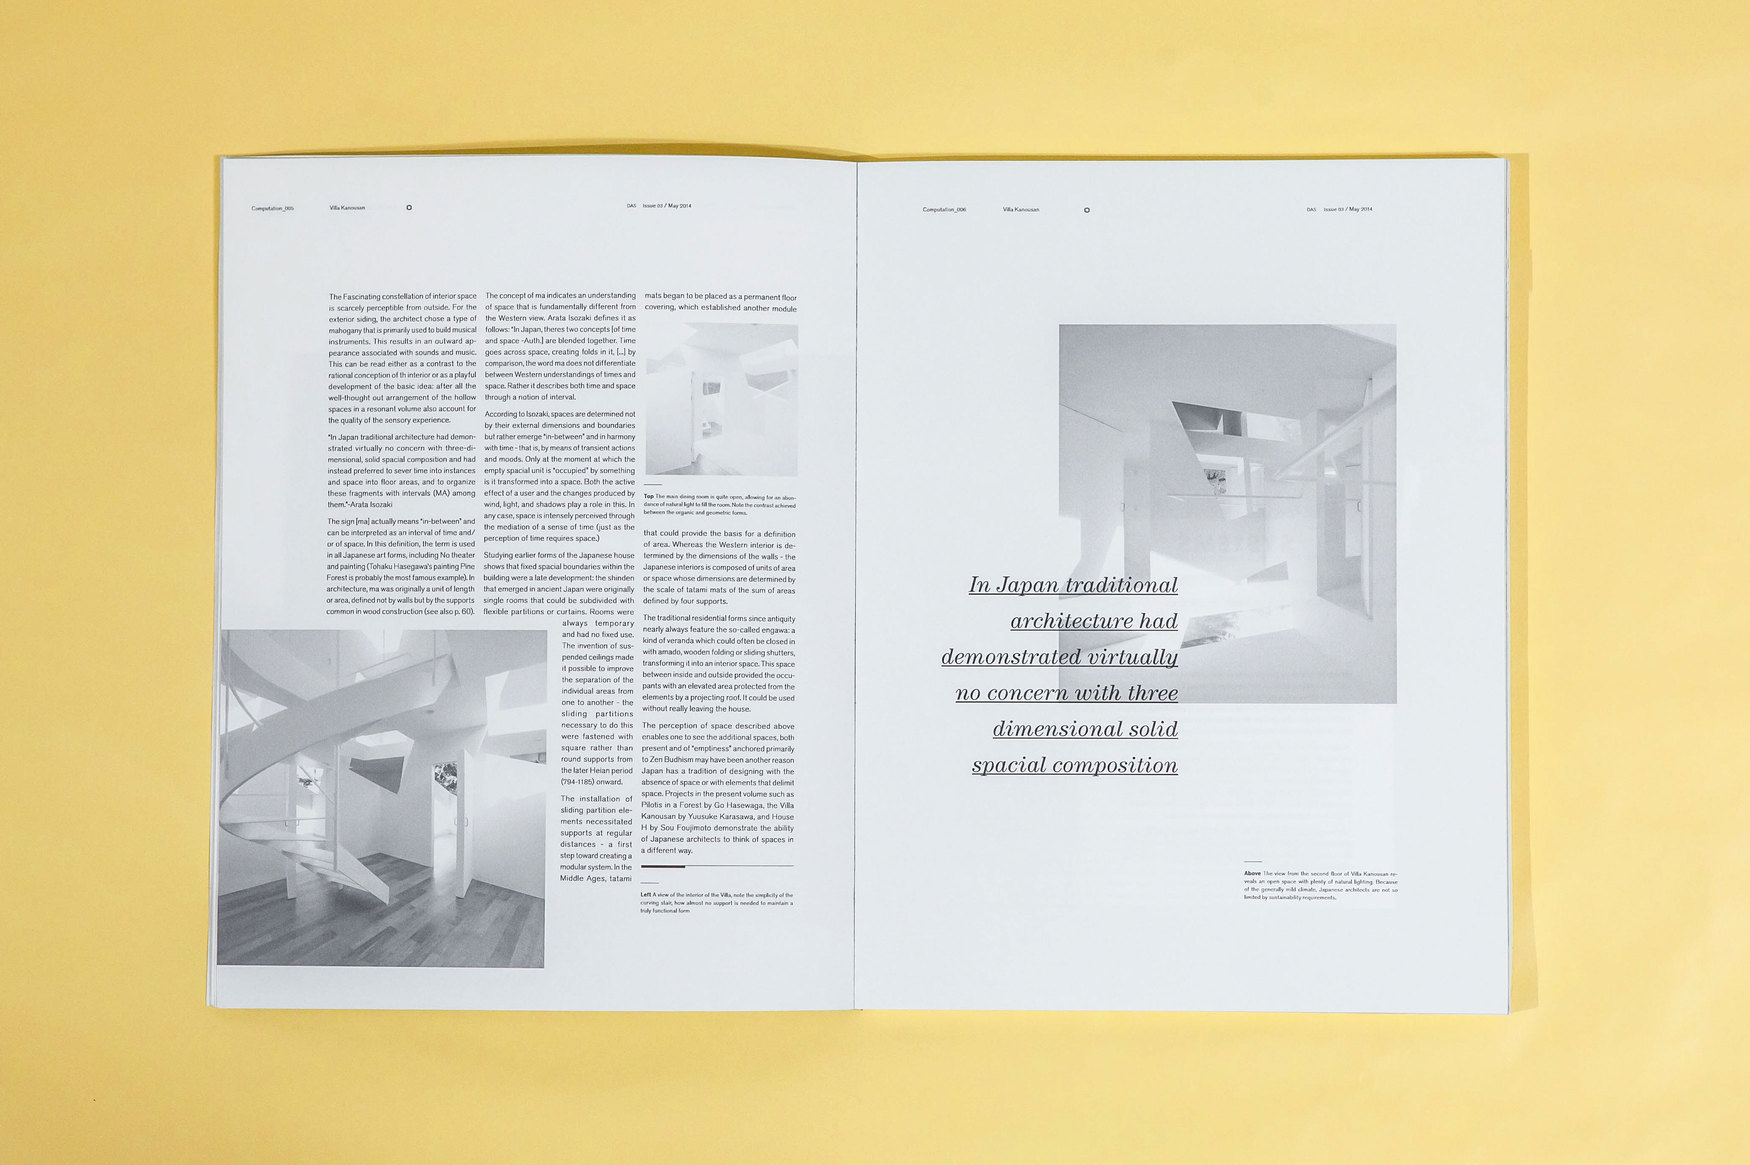
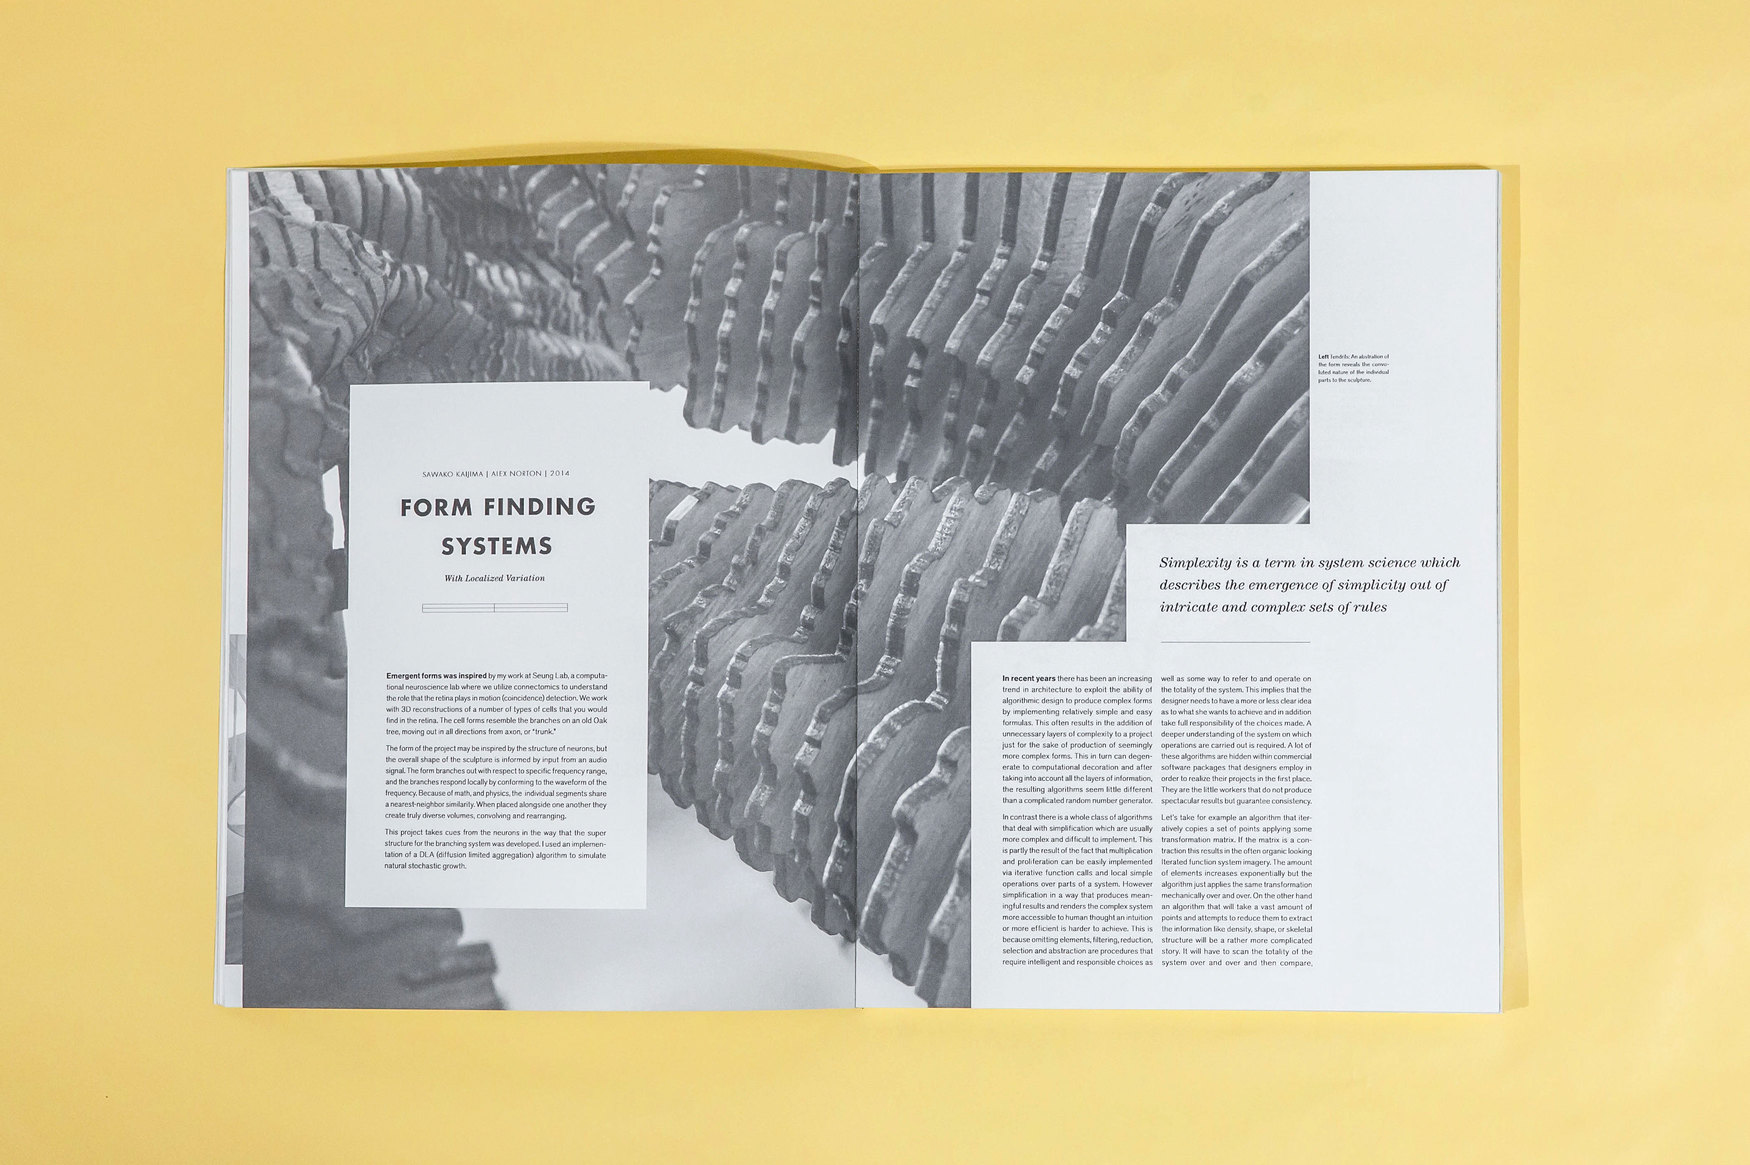
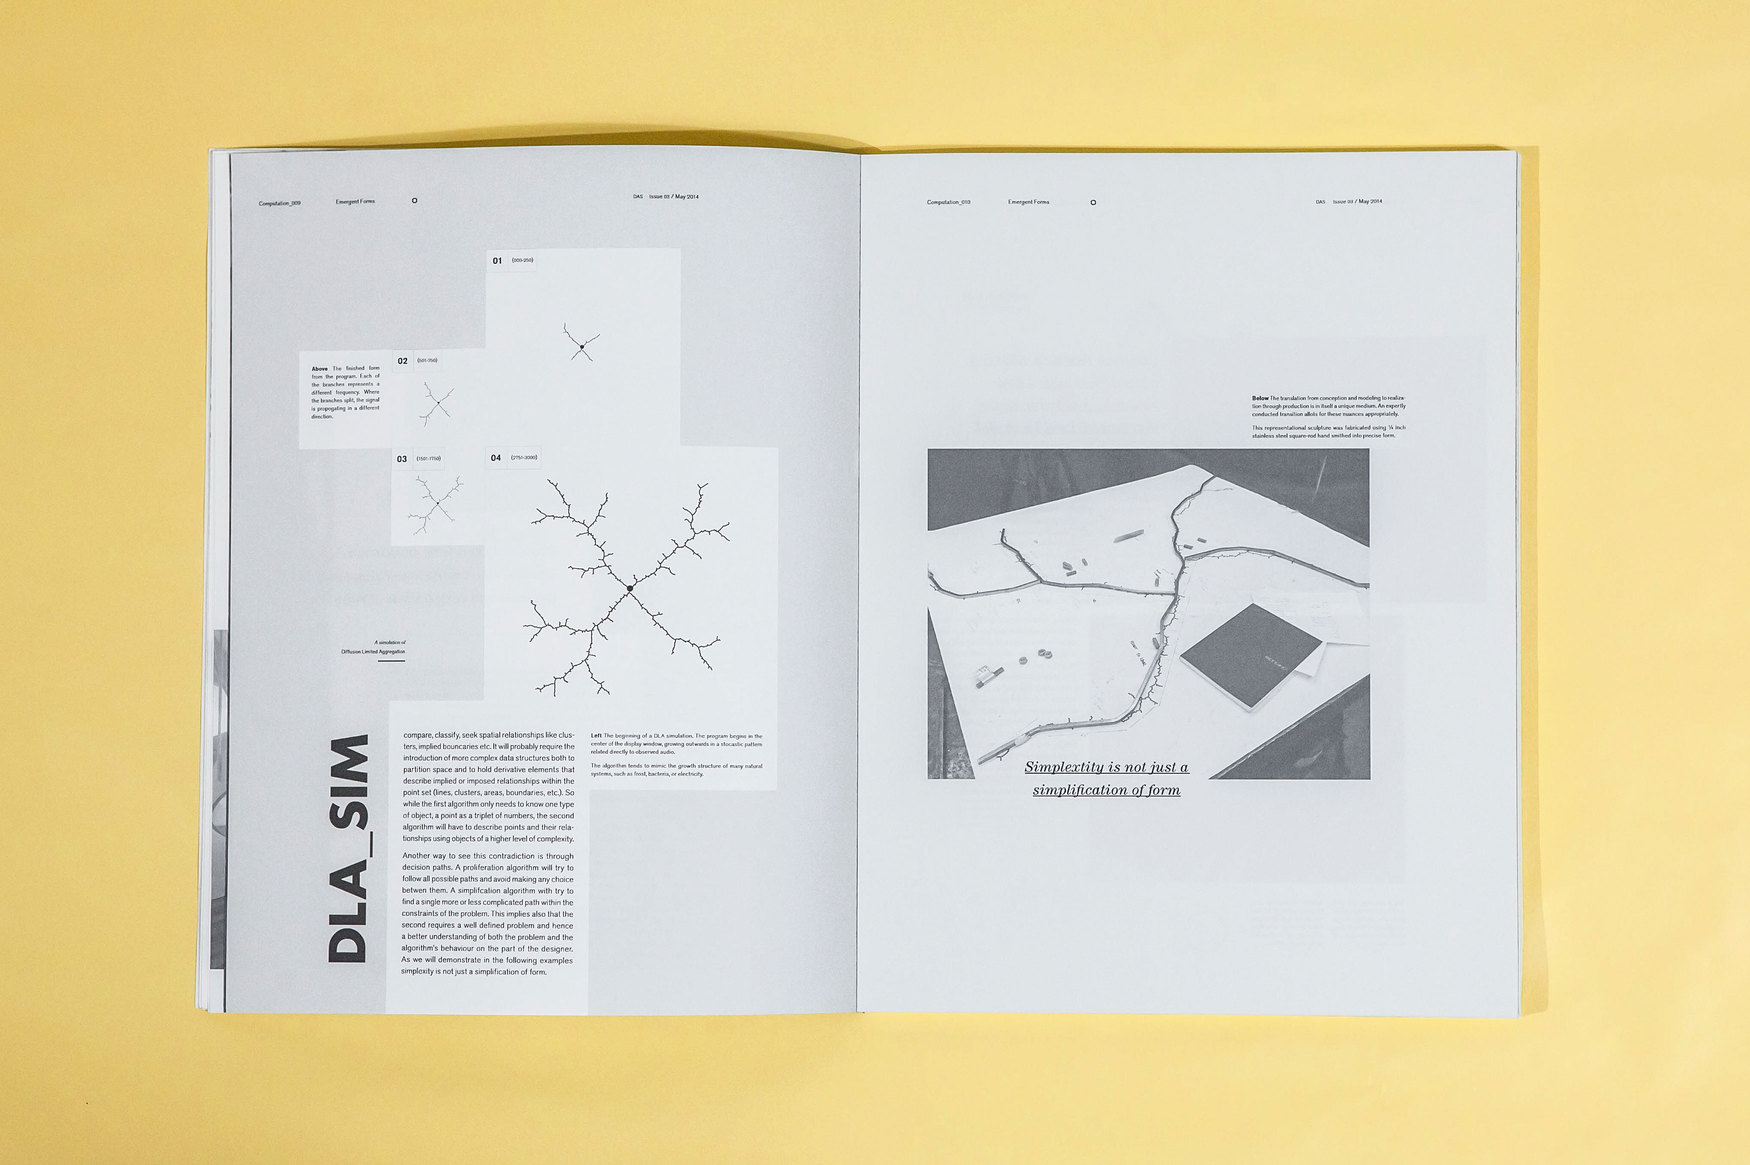
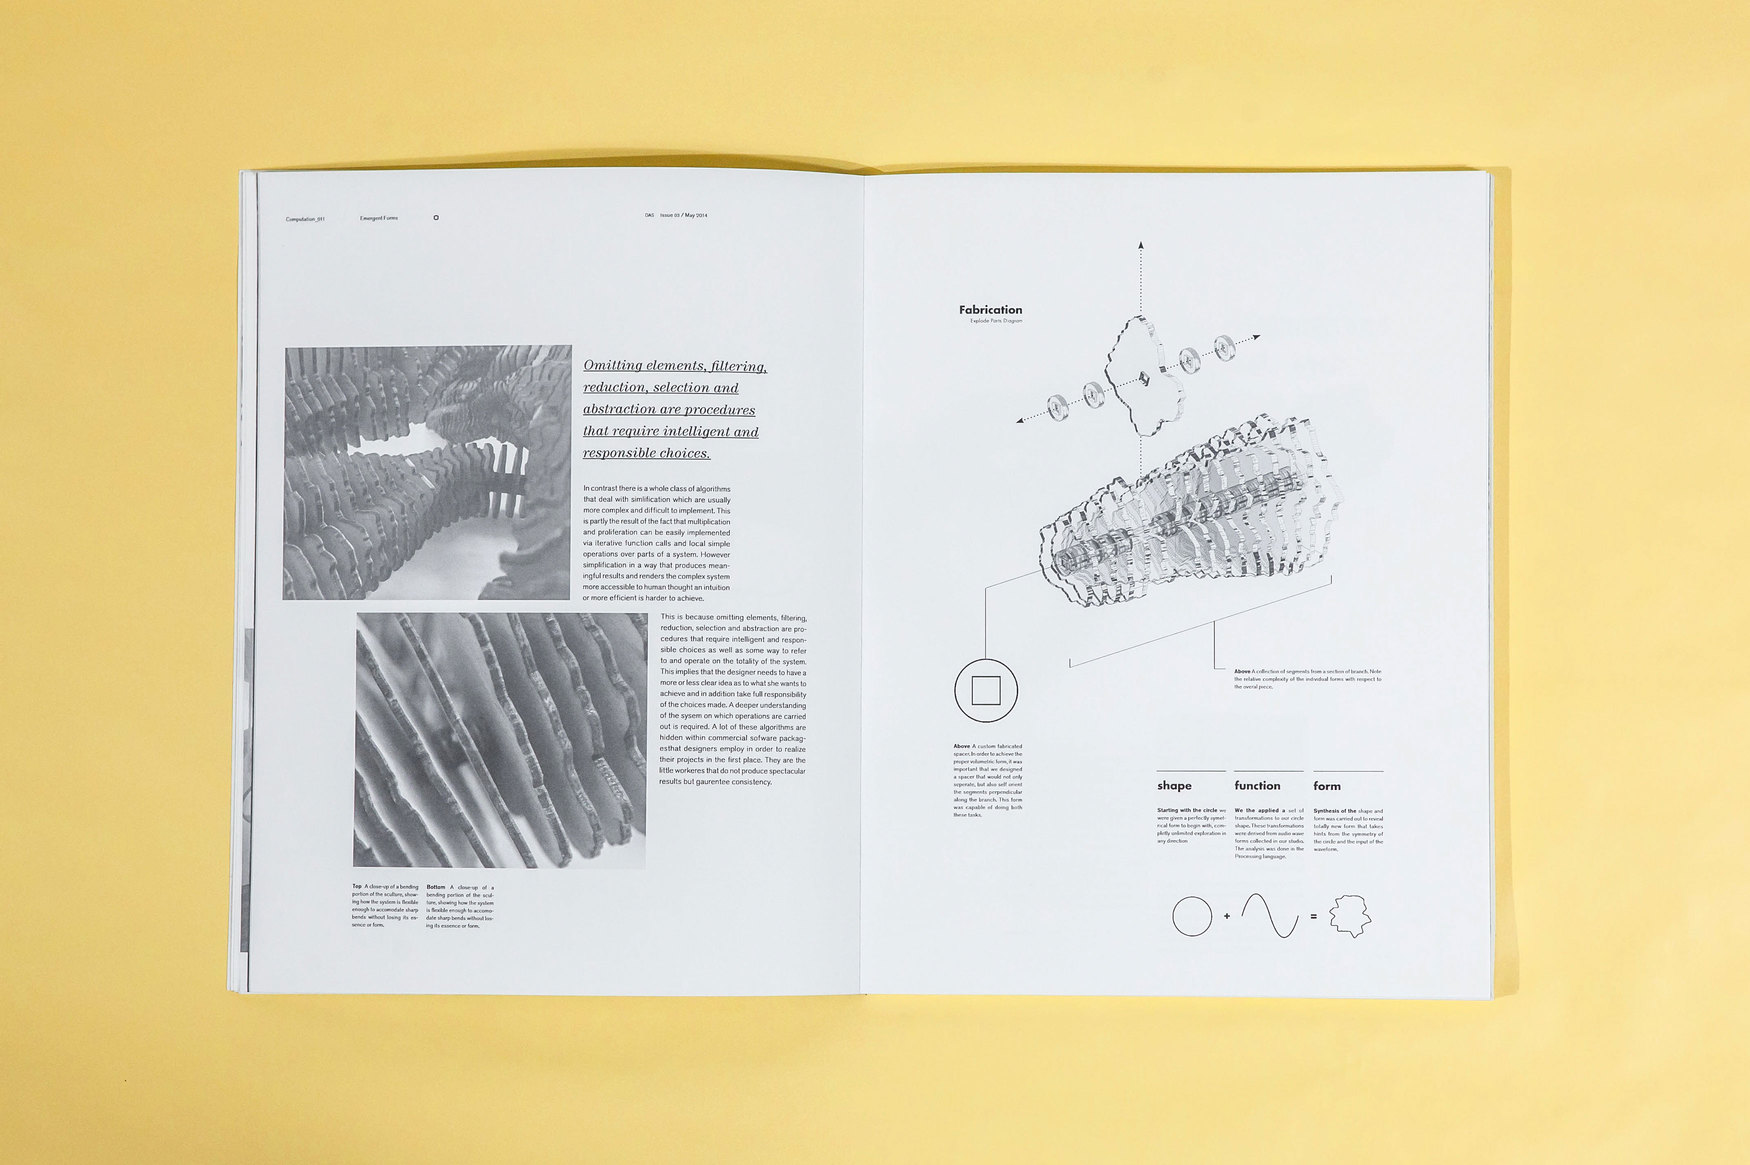
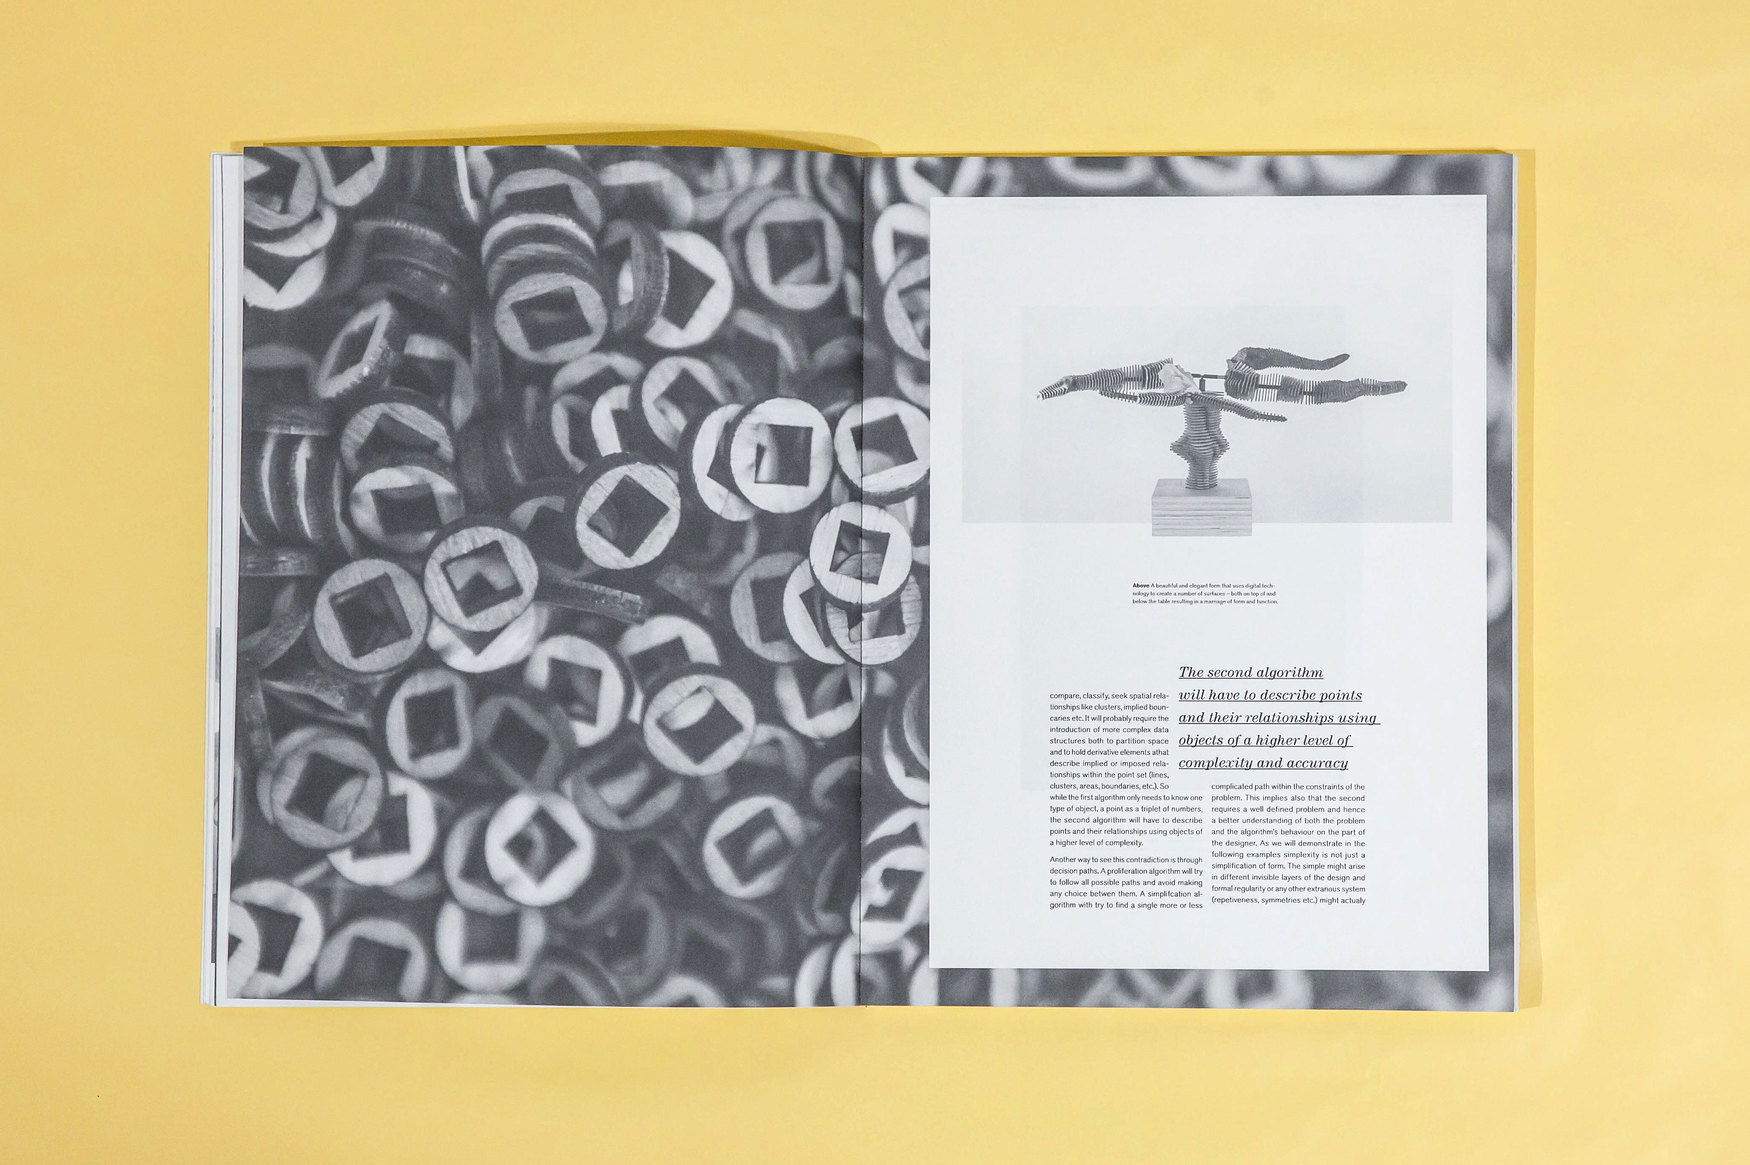
Playful, yet subtle typographic annomolies offer an entry point for lengthy compositions while the use of bold, artful photography empowers subject matter—even in black + white.
Project
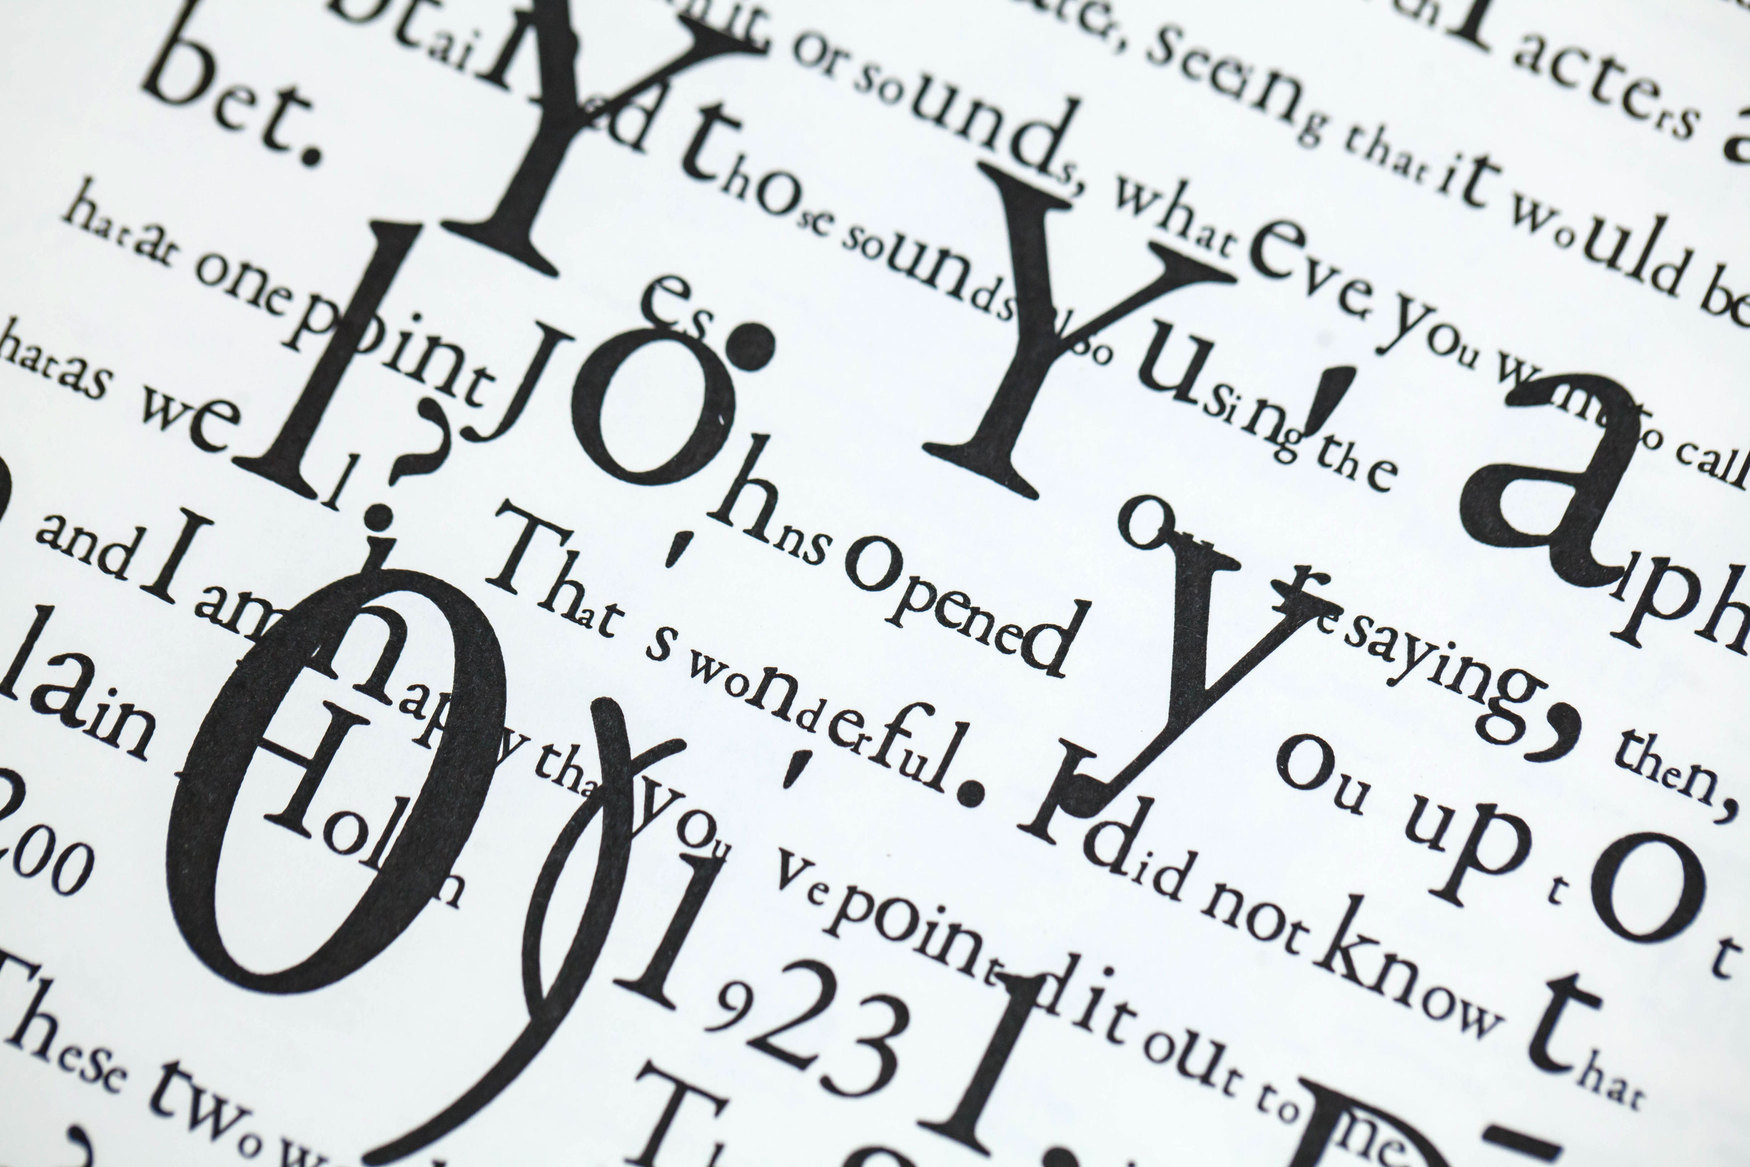
MuWu
How would algorithms mediate a conversation with the late composer, John Cage?
Brief
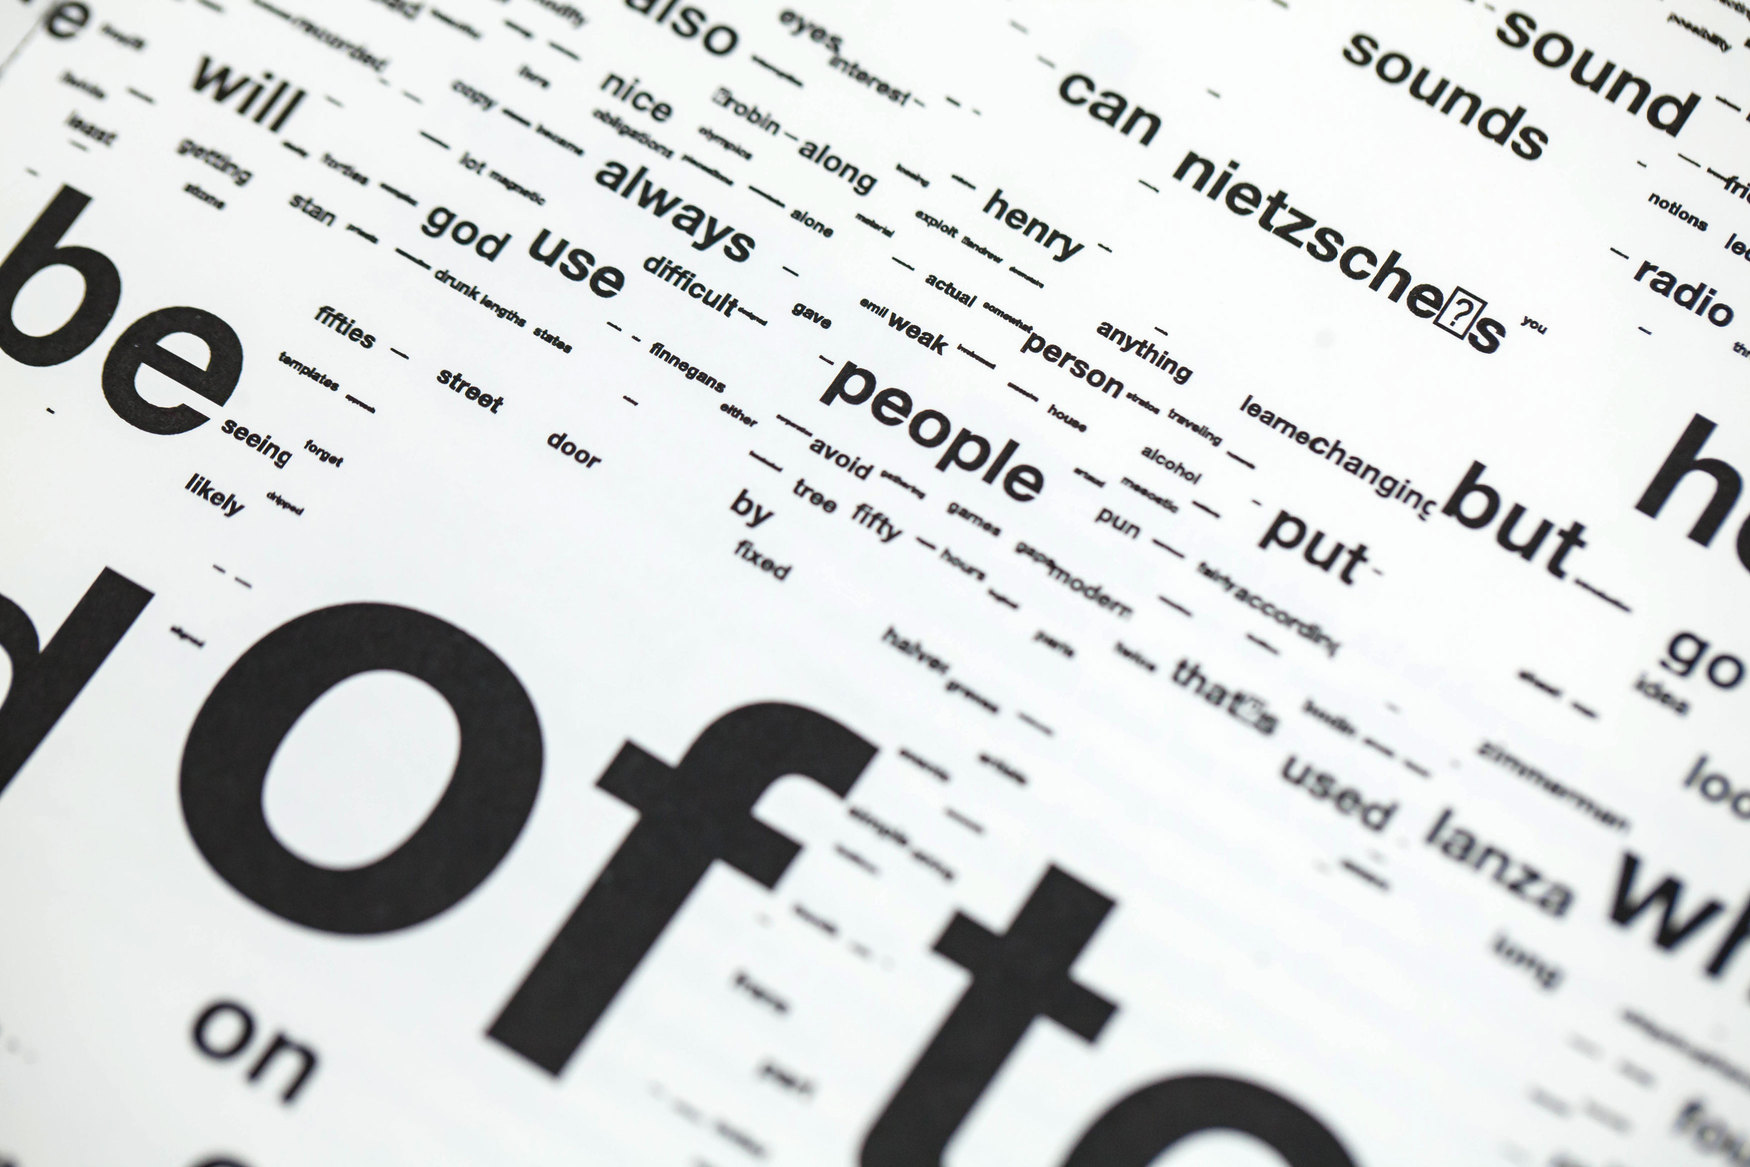
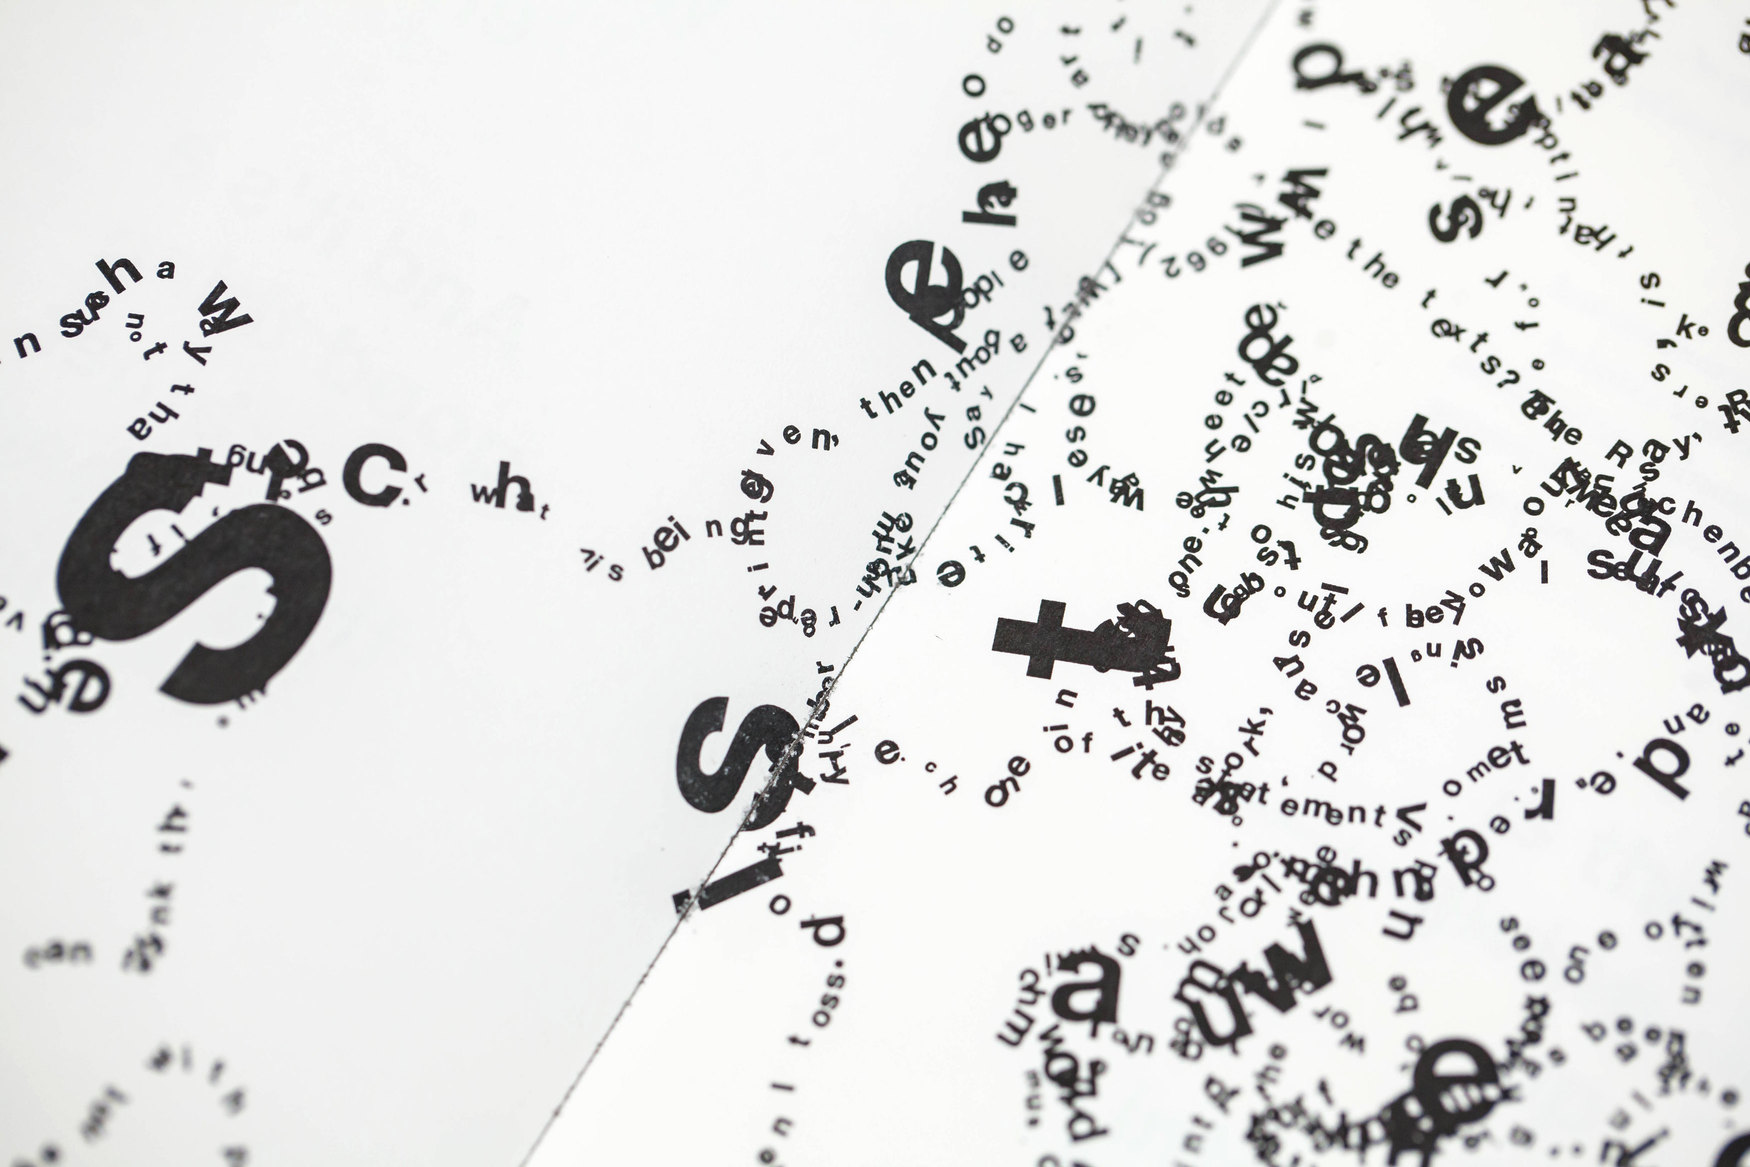
MuWu is a collection of the thoughts and the experience of John Cage. Inspired by the classic text, I Ching, MuWu is intended to ask questions. How is a book composed? What is language and how does it flow? After a single trip to China, John Cage was converted to a Taoist believer. He incorporated chance operations, found in the I Ching, into most of his artworks for the rest of his life. Letting go of intention and embracing the natural flow of tao led Cage to create some of the 20th century's most influential artworks. MuWu pays homaged to to late John Cage by continuing where he left off. The book uses a computational approach to to story telling to fill up exactly 64 body pages with unique content from the compilation, Conversing with Cage. The length was chosen in response to the 64 hexagrams of the I Ching. MuWu attempts to assemble completely new and unique thoughts from the any dialogues found in Conversing with Cage. This approach shifts creative control from the designer towards the algorithm.
Challenge
MuWu was concieved as a student project during my junior year of university. At the time, I was still quite new to programing and just getting my feet wet with the possibilities of design mediated computation. It was a serious risk to take on a full book publication using an unfamiliar technology and ambitious concept. Through the patience of my professors, many, many late evenings debugging, researching, and most importantly a marked propensity for experimentation MuWu came into existance. The final deliverable consisted of a set of eight hand-printed and hard-cover, hand-bound books of exceptional quality. When you leaf through MuWu, you feel none of the struggle, only a clear and simple concept and formal delivery.
Research
I found myself drawn towards the I Ching. It's system of trigrams and hexagrams felt like a sort of analog-computer. I designed a series of posters to better appreciate both the mechanisms and expanse of the divination system. Would it be possible to map these Taoist symbols into a robust and meaningful layout system?
Methods
Mu is the East Asian word descibing literally 'nothing', or 'un'. It is very curious that this is nearly the same meaning as the Greek letter 'μ' pronounced 'mu' which in modern academia is reference to a very small measurement. The title is appropriate as this text seeks to distance the design from the final outcome. Both the content and layout of the MuWu are algorithmically sampled. MuWu was sort of my introduction to the possibilities of generative design.


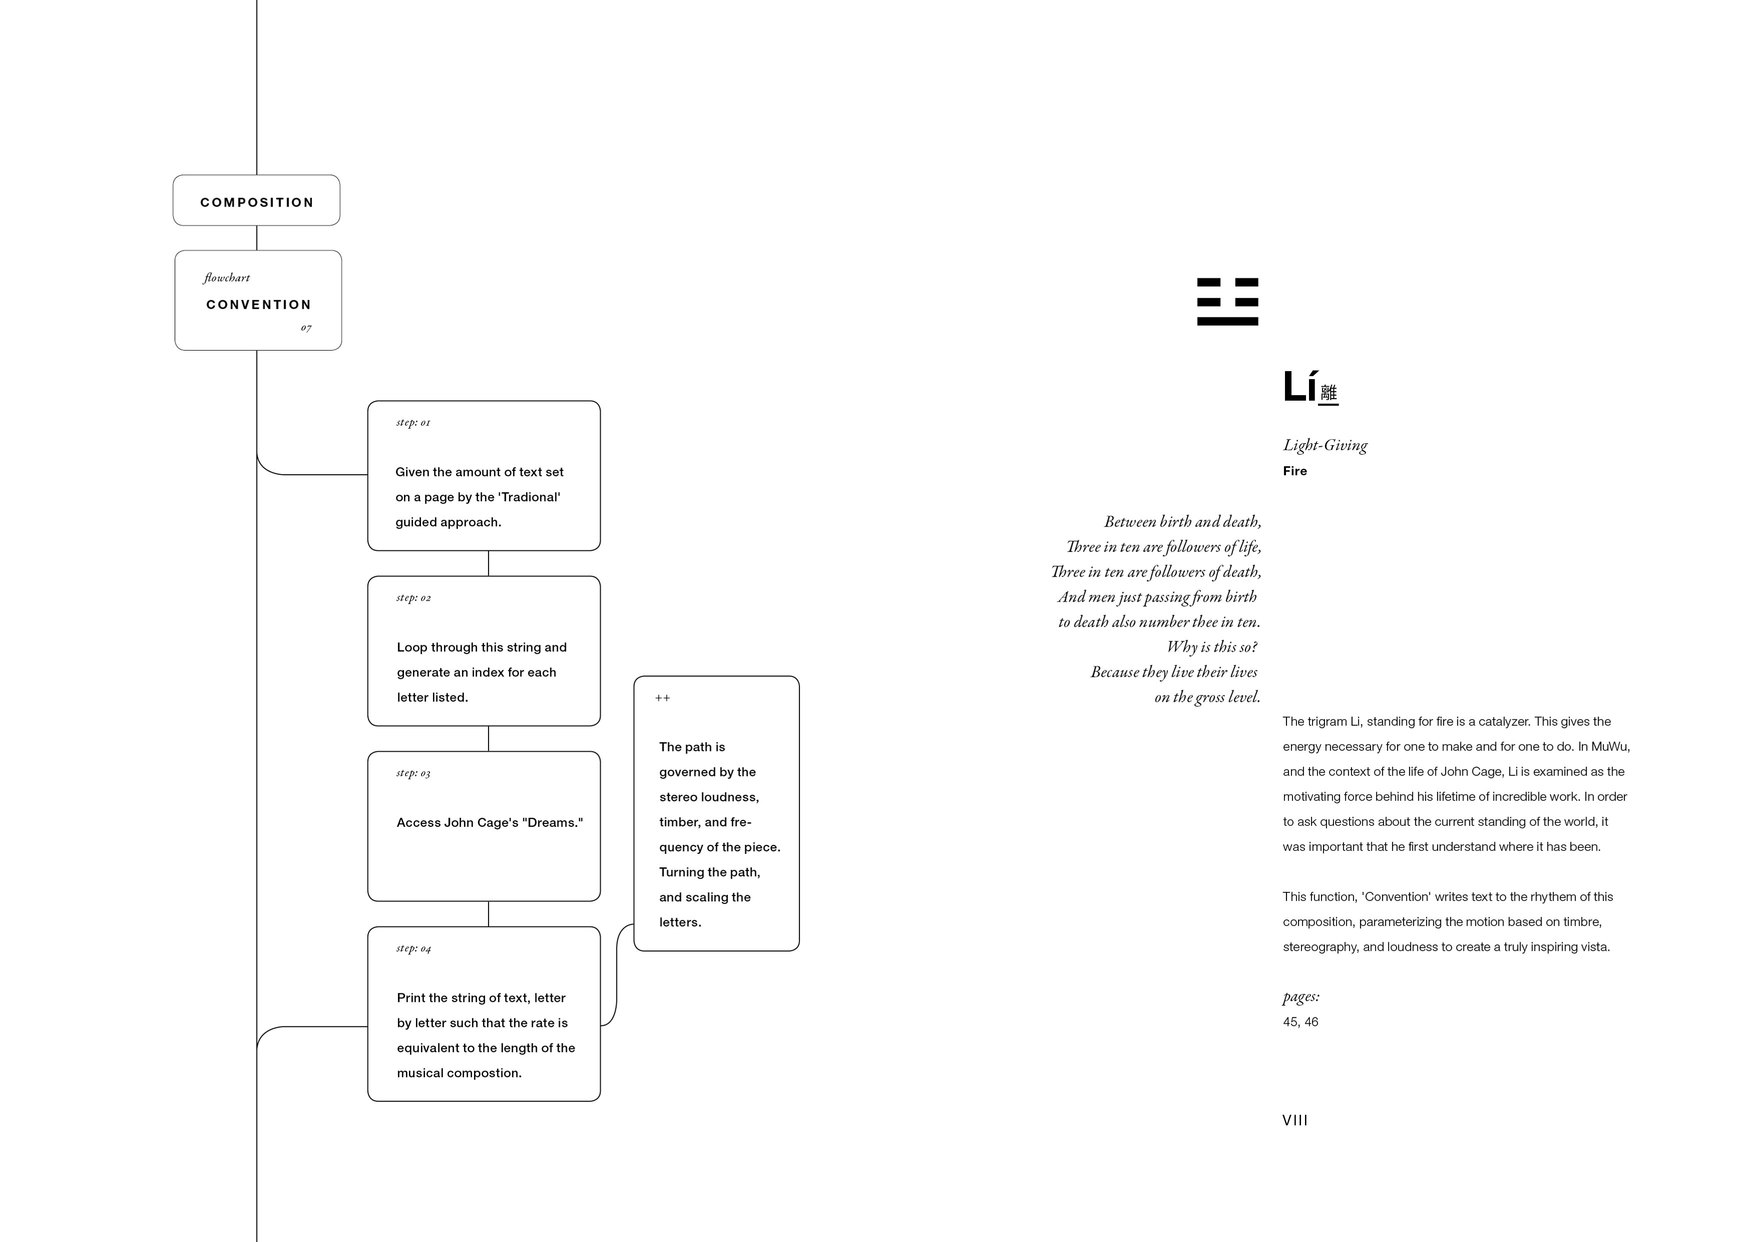
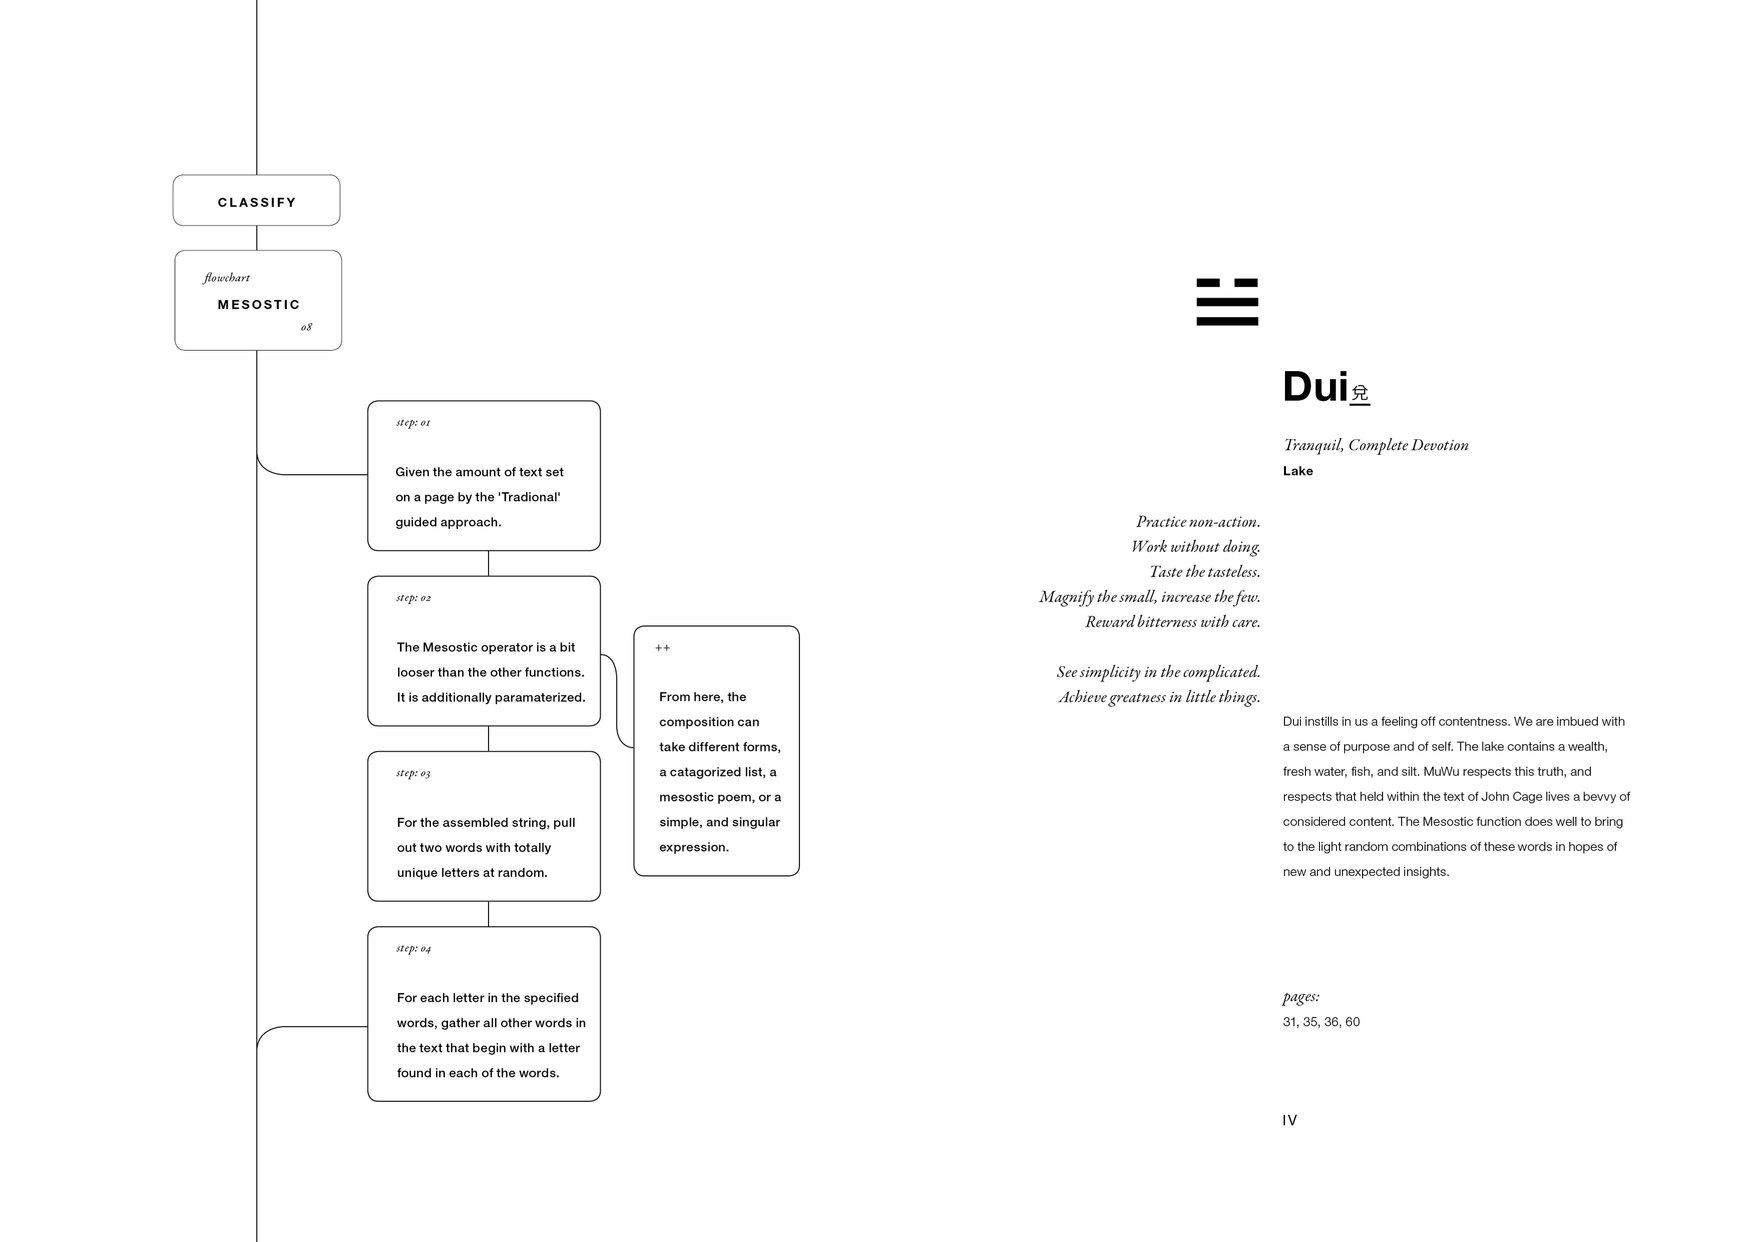
Layout Machine
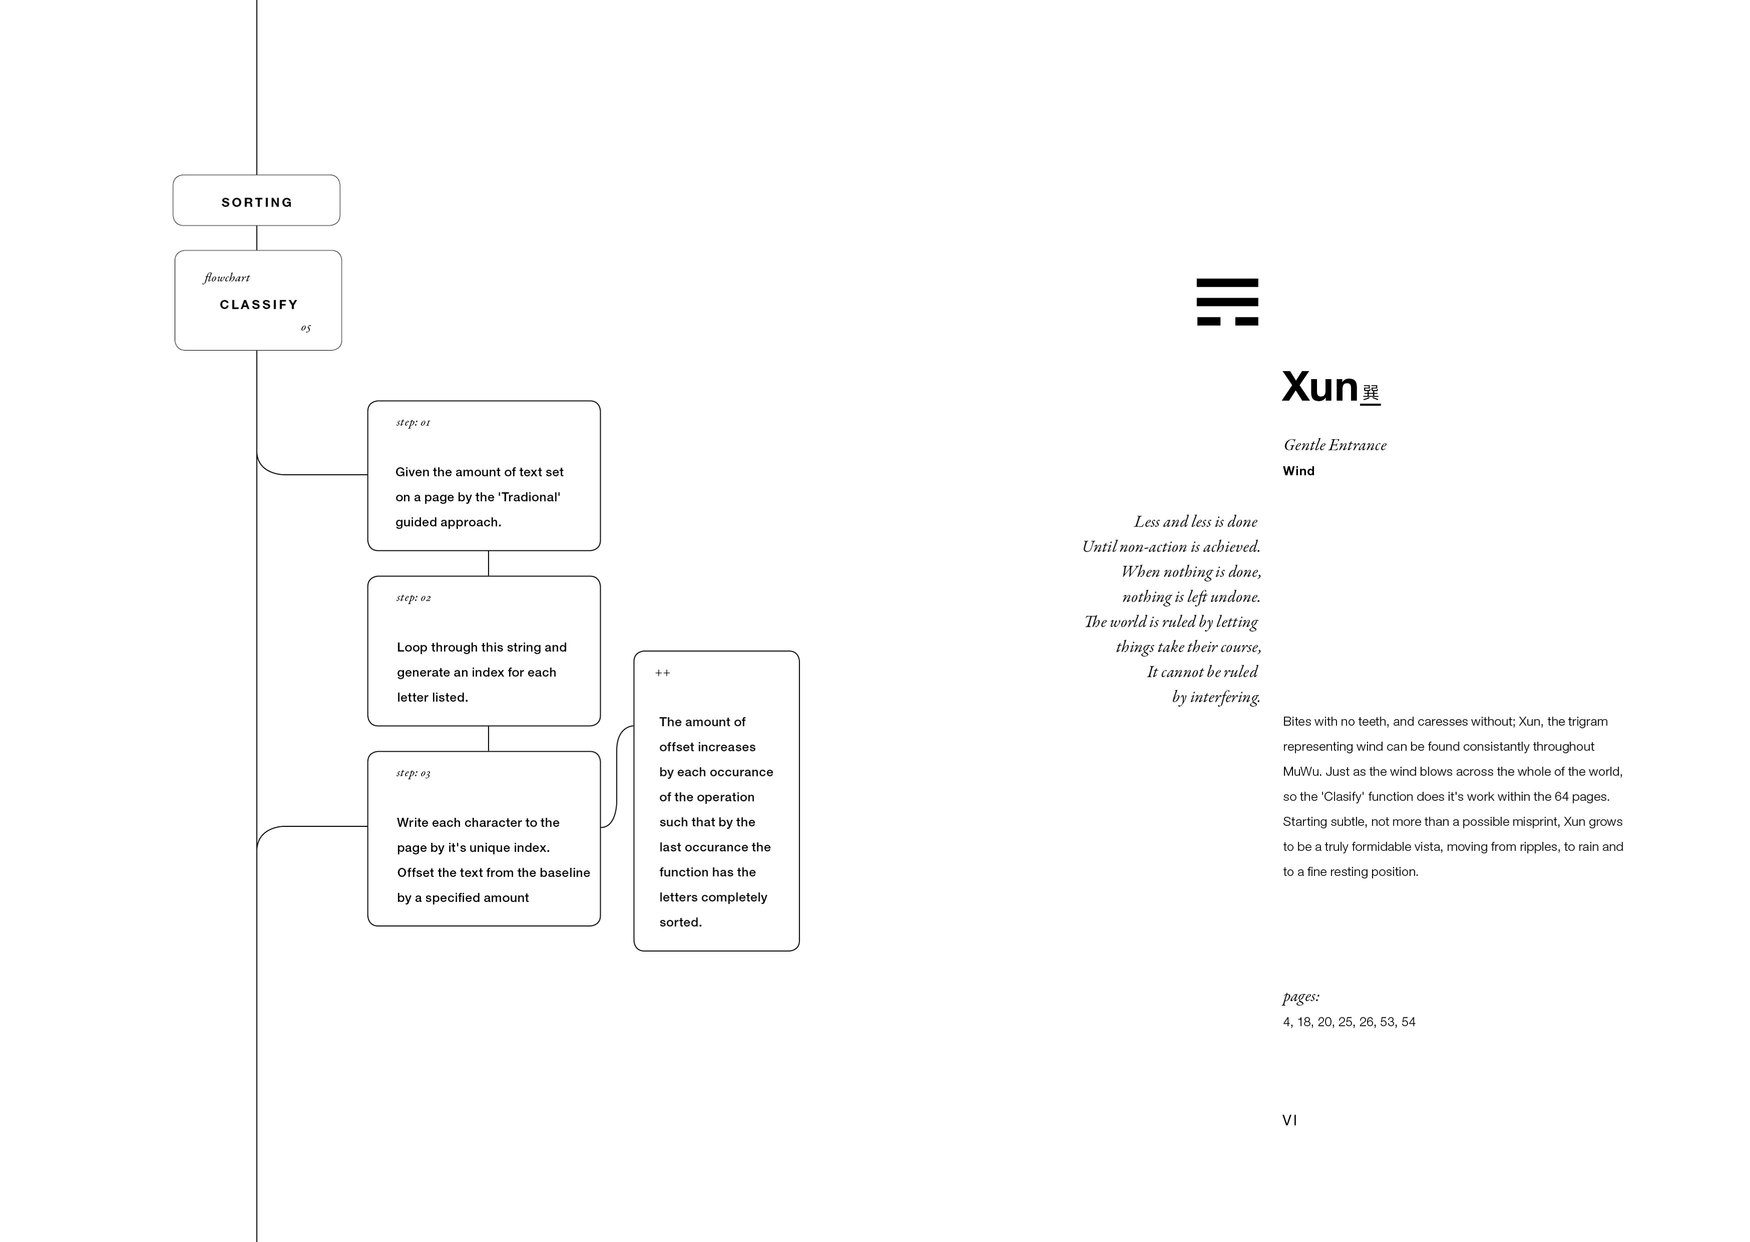
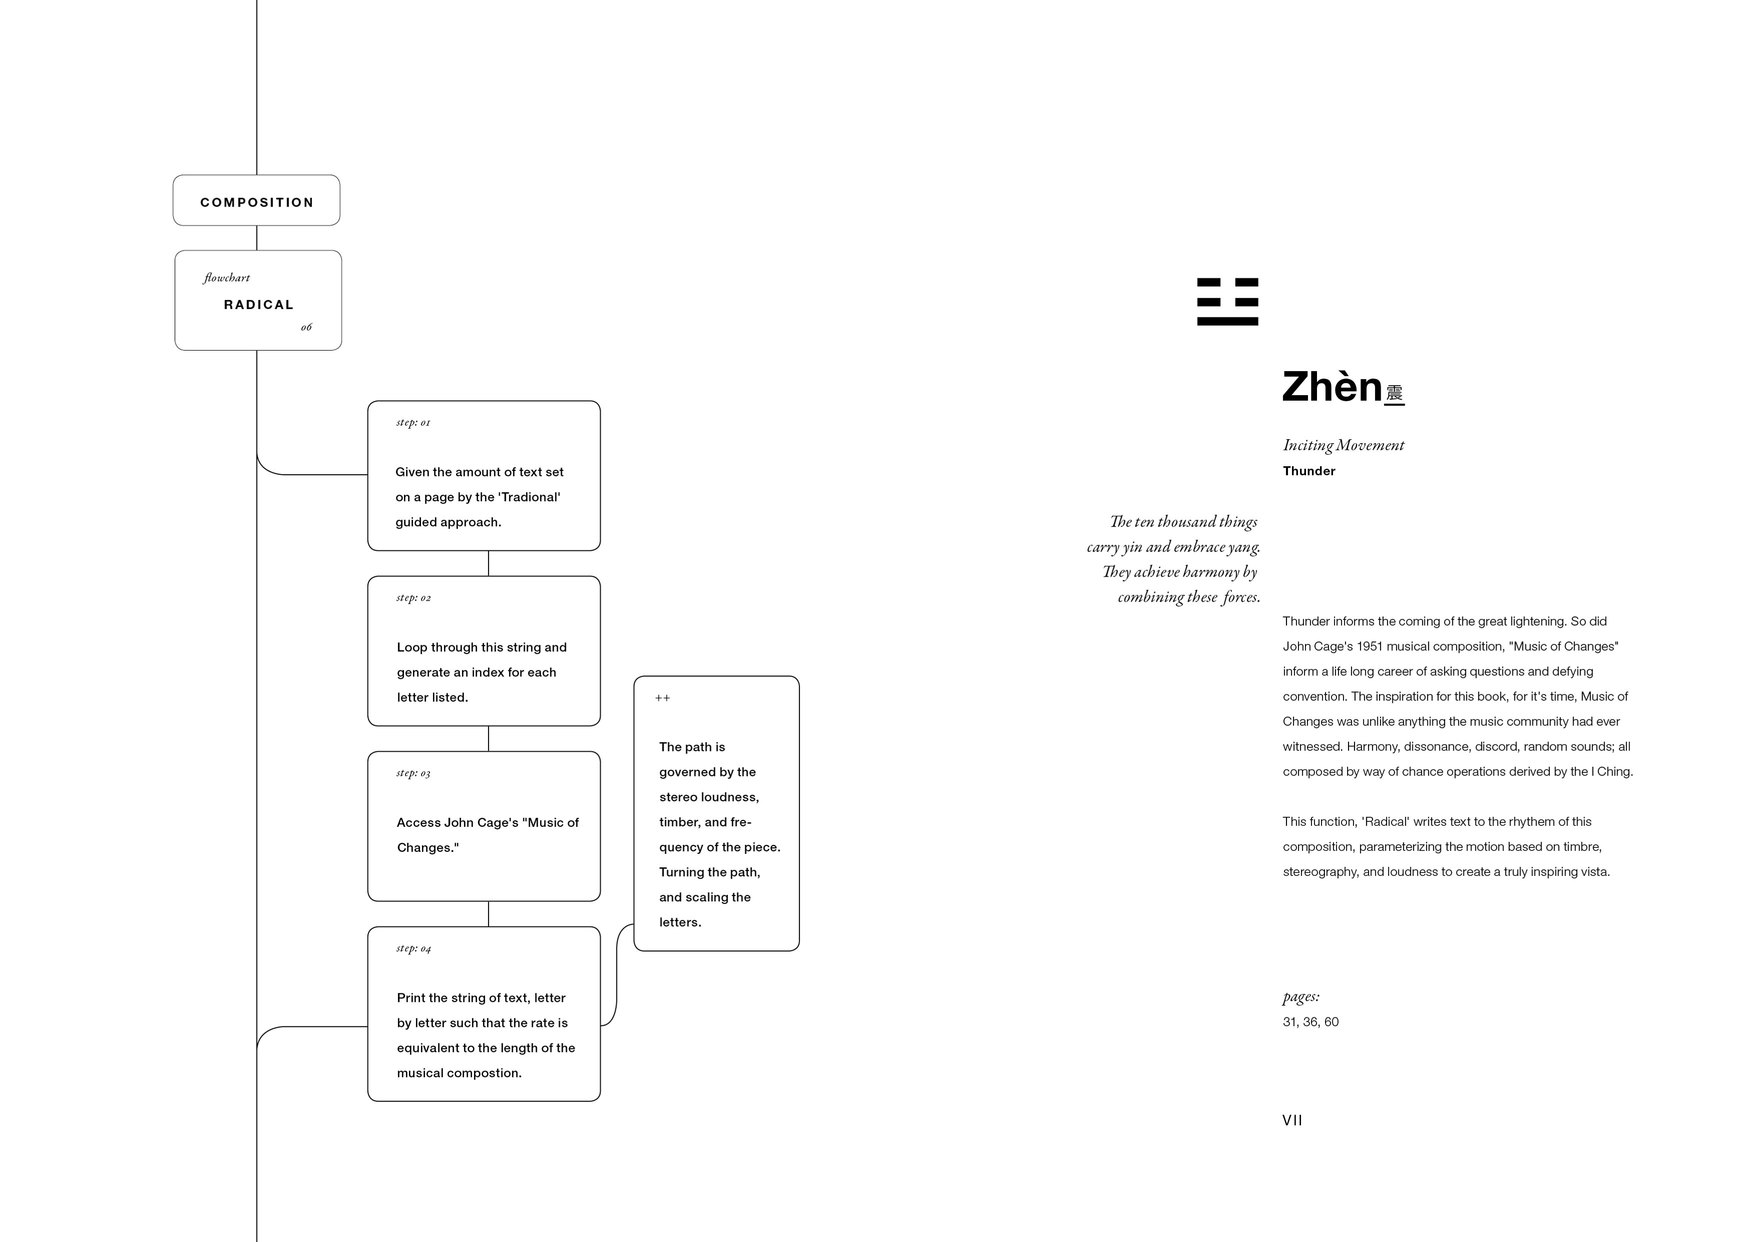
Layout Machine was developed to create book layout based on a predefined set of probabilities. It operates as a specialized, automated I Ching which John Cage used to create chance operations and indeterminate series for much of his work. Layout machine computes general, systematic layouts; it specifies the type of layout for a given page but not necessarily how it should be designed.
Layout Synthesis
I created a series of posters to visualize the output of Layout Machine and it's supporting algorithms. It's interesting to examine the form and continuity across the algorithmically generated designs.
Generative Algorithms
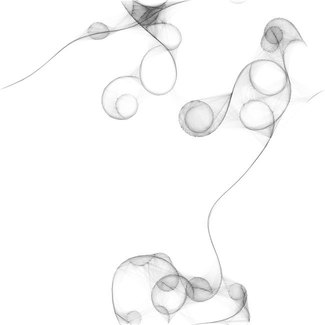
Muwu was my first project that leveraged the power and potential of generative design. Though highly conceptual, the project proved a gateway to many new ways of thinking and doing. The speed and flexibility of a new parametric graphic design became immediately clear, instead of pushing pixels and setting control points, I was pushing data, and controlling process flow. I used Processing, a language developed for creative coding to generate the content and much of the layout for Muwu.


Project
Our Epigenomes
A unisex collection informed by a careful investigation into genetic processes and systems.
Brief
Identical twins begin their lives in a very similar fashion, with nearly identical genomes inherited from their parents. The Our Epigenomes collection stems from a culmination of life experience. Although we are very close as identical twins and share much of the same genome, my sister and I couldn't be more unique. A lifetime of differing experiences has caused certain traits to develop, uniquely conditioning each of us to our respective environments. Epigenomes are trait differences not caused by DNA, epigenetic modification is occurs slowly, over a lifetime due to these differing experiences.
Challenge
Our Epigenomes is the first in a series of ready-to-wear collections by Gloria Im. Gloria and I collaborated on the design and art direction for a series of photo-shoots resulting in a look-book. We combined a love for graphic formalism with the dimensionality of architecure to achieve a look and feel that embodied a monumental sensibility.
Project
Cabin Cards
A greeting card protoype featuring a multi–dimensional identity system that stands on it's own.
Brief
In the spring of 2015, I, along with twelve fellow classmates, was invited to travel to Japan on behalf of the Kakehashi Creators Project. The form of the project was a two-week exchange of Japanese and American students—the aim of the project was to promote cultural exchange and foster international collaboration. Although the exchange lasted only two-weeks, we spent months preparing, learning about the history, cultral norms, and common language-isms. The two-weeks spent traveling Japan have been some of the most moving and transformative of my life.
Challenge
We were asked to design simple greeting-cards. The cards should include our name, discipline, and some form of contact information—the rest was up to us. At the time, I was taking traditional graphic design classes at MassArt while exploring the possibilities of design mediated computation at MIT. Most business cards are flat, and strictly information delivery vehicles—at best a business card could be memorable, maybe even novel. What if a business card were multi-dimensional? What if it invited interaction? Could a business card help to overcome a language barrier? I gave myself a single weekend to design, prototype, and fabricate 250 cards. This is the result.
Project
Jenga Unchained
Compete or collaborate in a constructivist boardgame inspired by tetris and jenga.
Brief
Jenga Unchained was concieved during to Neri Oxman's 'Design Across Scales' course at MIT Media Lab. The prompt was simple, create a response that embodies 'The design of play.'' Instead of trying to invent a new game from scratch we explored classic game design concepts by totally reversing the rules. If the game was played in 2D, how would it feel in 3D? If the game was about destruction, how would it feel being constructed? After loads of playful conversations and paper prototyes, we settled on a concept for a game that could be played either competitively or collaboratively. We called this game Jenga Unchained.
Challenge
I worked on an interdiscplinary team including two architects and an economist. I found it super interesting learning about the motivations of my fellow teammates. Each of us had a different notion of the concept of play, so initial brainstorms were all over the place. What immediately felt like a hinderance led us to a successful melding of minds. The architects pushed for 3D forms with haptics, the economist wanted a system that could be exploited for value, and I was intrigued by the possibility given by modularity. The final game felt like the combination of our unique ideas.
CAD Designs
Before moving to our final design phase, we prototyped a multiplicity of tetris-inspired stackable 3D shapes.


I'm Alex Norton,
Product Designer
Glyph simulation rendered using p5js
Physics applied using toxiclibs

Hello, I'm a product designer building the future of travel planning at Google.
About
I'm a Product Designer on Google Travel where I craft assistive and accessible tools for travel planning. I'm a contributor to Google’s People + AI Guidebook and have mentored startups on the intersection of business, AI, and design.
My visualizations have been featured at TED, Tribeca Film Festival, and in Times Square NYC. And my work has appeared in Wired magazine, the New York Times, and in Nature and Cell scientific journals.
When not designing, you can find me in search of the perfect breeze, sailing FSS Apogee out of Boston Harbor
Case Study
Google Travel
The People + AI Guidebook was written to help user experience (UX) professionals and product managers follow a human-centered approach to AI.
People + AI Guidebook
Examining the possibility of systems, lateral thinking, and the role of storytelling in futurecasting for assistive products and features.
Relational Design
Accelerating neuroscience research and discovery by open sourcing a collaborative, online platform.
Museum
Volunteering as design director to create a distinct and memorable brand for a Boston TEDx chapter.
TEDxBeaconStreet
How does a brain make a mind? Experience the wonder in virtual reality at Tribeca Film Festival.
BrainVR
Prototyping a possible future for the worlds smartest citizen science project.
Synapse
Bringing the future of neuroscience exploration and education to virtual realms using the Oculus Rift.
MSTY VR
Refreshing Eyewire’s landing page with the addition of an interactive narrative-driven explore section.
Eyewire Explore
Journey into the depths of the retina with the Dig, Eyewire's next big Adventure.
The DiG
Design is not a discipline, but a way of looking at the world.
DAS
How would algorithms mediate a conversation with the late composer, John Cage?
MuWu
A unisex collection informed by a careful investigation into genetic processes and systems.
Our Epigenomes
A greeting card protoype featuring a multi–dimensional identity system that stands on it's own.
Cabin Cards
Compete or collaborate in a constructivist boardgame inspired by tetris and jenga.
Jenga Unchained
Interested in working together or simply meeting up?
I love sharing adventures, discovering new design, and exploring emerging technology—especially AI.
Let's Talk.
alexnortn@gmail.com
774 766 1179
2021 Alex Norton